UAE Real Estate Cycles in 2026: Dubai's Boom, Peak, Correction and Recovery Explained
- Published 24 Dec 2024
- Updated 10 November 2026
- 11 min read
- Data verified on 10 Nov 2026
In short
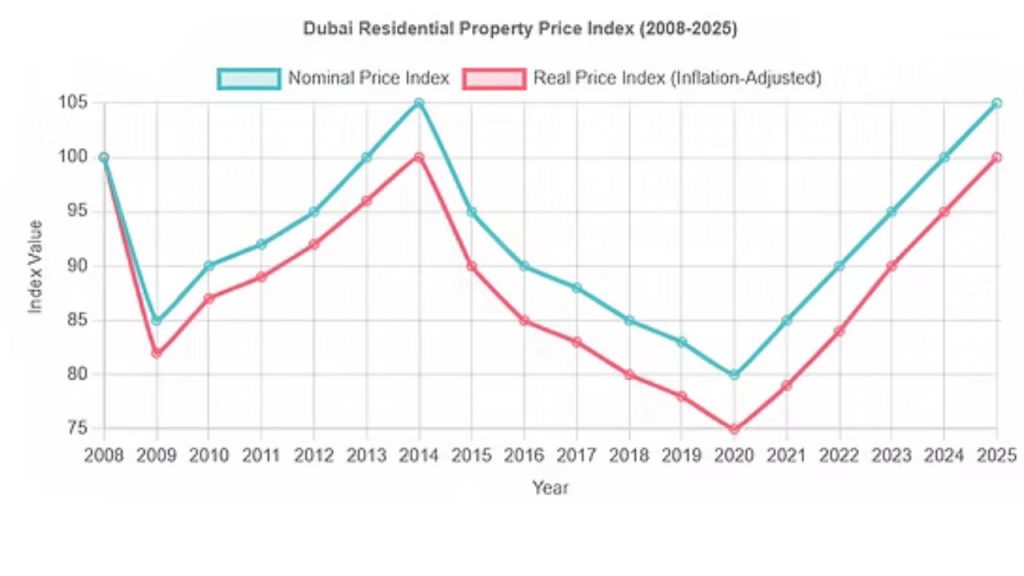
UAE real estate cycles move through boom, peak, correction and recovery, and Dubai’s are fast and sharp. Prices fell by about half in 2008–09, slid 12.5% from 2014 to 2020, then rose 79.3% between 2020 and 2025 (12.4% a year) to a record AED 1,671 per sq ft. In 2026 Dubai entered a moderate, volume-led correction: October prices were 3.8% lower year on year and sales 40% lower. Lower leverage and less speculation make a 2009-style crash less likely.
DXBinteract analysis of DLD sale registrations, 2012–Oct 2026 · Cluttons, 2013 · ValuStrat, Q3 2026 · Knight Frank, 2026
+79.3%2020–2025
Rise in Dubai’s median sale price per sq ft from the 2020 low to the 2025 high
Source: DXBinteract / DLD, retrieved 10 Nov 2026
−49.7%after 2008
Fall in Dubai property values after the global financial crisis
Source: Cluttons, Summer 2013
−3.8%year on year
Median price per sq ft in October 2026 (AED 1,639), with sales down 40%
Source: DXBinteract / DLD, Oct 2026
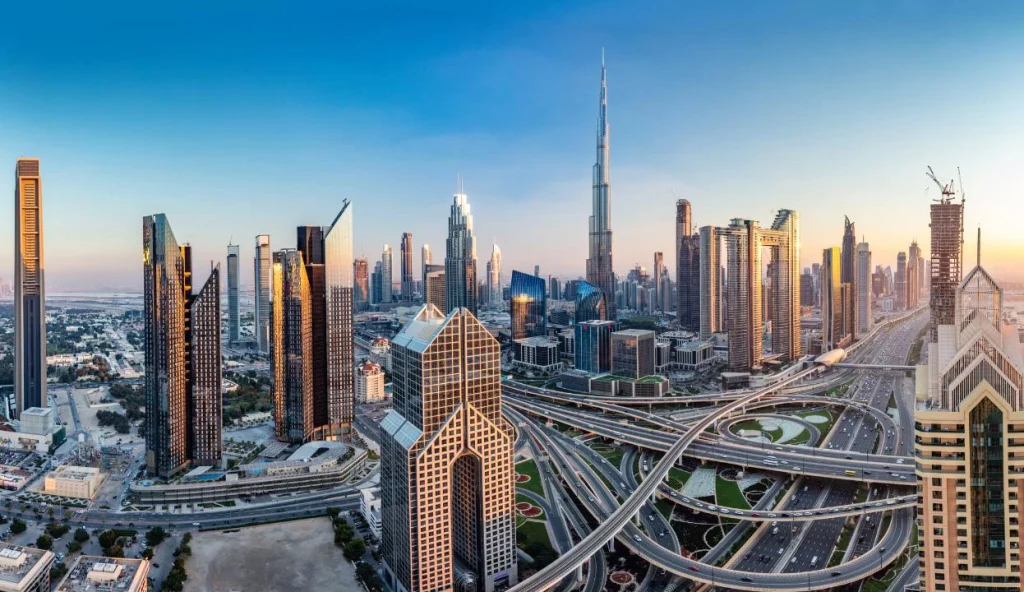
Dubai has gone through four full property cycles since 2008.Photo: © VALORISIMO
What are the four phases of a real estate cycle in Dubai and the UAE?
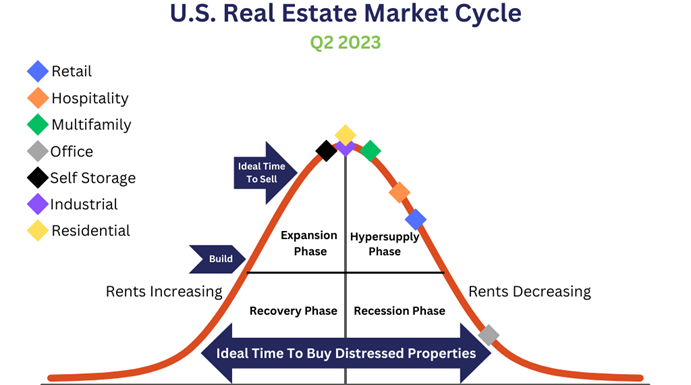
Property markets move in four broad phases: boom, peak, correction and recovery. Dubai goes through them faster and more sharply than most cities, because a large share of buyers are international investors and a large share of sales are off-plan.
Cycles are driven by the same forces everywhere: economic growth, population inflows, credit, government policy and the balance between new supply and demand. In Dubai, two local features amplify them. First, developers can launch tens of thousands of units within months when demand is strong, and those units are delivered three or more years later, often into a different market. Second, off-plan payment plans let buyers commit with small deposits, which accelerates both the upswing and the slowdown.
Boom: rising demand, rising launches
Sales volumes and prices rise together, rents climb, and developers launch more projects. Dubai’s 2021 to 2025 run is a textbook boom: registered sales went from 61,129 in 2021 to 215,608 in 2025, and units launched jumped from 26,078 to 172,955.
Peak: prices high, momentum fading
Prices are at or near their highs, but growth slows, affordability stretches and the pipeline of unsold or undelivered stock grows. Sales volumes often fall before prices do. Speculative buying and quick resales are a warning sign at this stage.
Correction: falling prices, buyer’s market
Prices fall, transaction volumes drop further, sellers cut asking prices and developers offer discounts or longer payment plans. Corrections in Dubai have ranged from mild single-digit declines to the near halving of values after 2008.
Recovery: stabilisation and renewed growth
Prices stop falling, volumes pick up, rents firm and new demand absorbs the excess supply. Recoveries are usually led by ready homes in established communities, and often by policy changes such as new visa rules or infrastructure spending.
How severe was Dubai's 2008–09 property crash?
The global financial crisis produced Dubai’s deepest correction on record: values fell by roughly half within about a year of the 2008 peak, and the recovery took several years.
Gulf News reported that UAE property prices “dropped by half in less than a year” from their late-2008 peak. Consultancy Cluttons measured a 49.7% fall in Dubai values after the recession; by mid-2013 prices were still 31.1% below their 2008 peaks, though 36.9% above the low of the second quarter of 2009. Fitch’s Lopatin, quoted by Fortune in 2026, summarised the 2009 crash as prices falling “by up to 40–50%”.
| Measure | Figure | Source |
|---|---|---|
| Fall from late-2008 peak | About half in less than a year | Gulf News |
| Total fall after the recession | −49.7% | Cluttons, Summer 2013 (via Gulf News) |
| Mid-2013 vs 2008 peak | −31.1% | Cluttons, Summer 2013 |
| Mid-2013 vs Q2 2009 low | +36.9% | Cluttons, Summer 2013 |
| Range of the 2009 price fall | Up to 40–50% | Fitch (Fortune, 1 Jun 2026) |
| Homes resold within 12 months, 2008 boom | 25% | Knight Frank |
Sources as listed. Gulf News, c. 2010; Cluttons Dubai report, Summer 2013; Fortune, 1 June 2026; Knight Frank, 2026.
Why it was so violent
The 2008 boom was built on speculation and leverage. Knight Frank estimates that a quarter of homes bought in the 2008 boom were resold within 12 months. When global credit froze, that flow of short-term buyers disappeared almost overnight, and sellers who had counted on a quick resale had to cut prices to exit.
What happened between Dubai's 2014 peak and the 2020 low?
After a fast recovery to 2014, Dubai went through a long, shallow correction: the median sale price per square foot slipped from AED 1,065 in 2014 to AED 932 in 2020, a 12.5% decline spread over six years.
| Year | Median AED/sq ft | Change | Sales | Phase |
|---|---|---|---|---|
| 2012 | 859 | – | 38,367 | Recovery (cycle low) |
| 2013 | 933 | +8.7% | 64,005 | Boom |
| 2014 | 1,065 | +14.1% | 56,196 | Peak |
| 2015 | 985 | −7.5% | 47,190 | Correction |
| 2016 | 979 | −0.6% | 41,188 | Correction |
| 2017 | 1,034 | +5.6% | 47,226 | Pause |
| 2018 | 1,040 | +0.6% | 32,962 | Correction (volumes) |
| 2019 | 993 | −4.5% | 38,734 | Correction |
| 2020 | 932 | −6.1% | 34,725 | Trough |
Source: DXBinteract analysis of Dubai Land Department sale registrations, all property types, ready and off-plan (retrieved 10 Nov 2026). Phase labels are Valorisimo’s reading of the series. Sales = residential and commercial sale registrations including off-plan.
What drove the slow slide
Lower oil prices from 2014, a strong US dollar (to which the dirham is pegged) and a steady stream of deliveries are the factors most often cited for the slide. Unlike 2009, there was no credit freeze: the decline was gradual and volumes, rather than prices, took the hit. Registered sales fell from 64,005 in 2013 to 32,962 in 2018. The pandemic in 2020 marked the final low, at AED 932 per square foot and 34,725 sales.
The lesson for investors: not every correction is a crash. A long, flat market with slowly falling prices can be just as costly in opportunity terms, and it rewards buyers who focus on rental income rather than resale gains.
How big was Dubai's 2021–2025 property boom?
From the 2020 trough to 2025, Dubai’s median sale price per square foot rose 79.3%, a compound annual growth rate of 12.4%, and sales volumes grew more than sixfold.
| Year | Median AED/sq ft | Change | Sales | Value of sales | Units launched |
|---|---|---|---|---|---|
| 2020 | 932 | −6.1% | 34,725 | AED 71.0bn | 7,589 |
| 2021 | 1,010 | +8.3% | 61,129 | AED 150.8bn | 26,078 |
| 2022 | 1,210 | +19.8% | 96,518 | AED 263.7bn | 52,426 |
| 2023 | 1,378 | +13.9% | 133,638 | AED 412.3bn | 91,858 |
| 2024 | 1,536 | +11.5% | 181,699 | AED 524.6bn | 169,266 |
| 2025 | 1,671 | +8.8% | 215,608 | AED 686.3bn | 172,955 |
Source: DXBinteract analysis of Dubai Land Department sale registrations, all property types, ready and off-plan (retrieved 10 Nov 2026); units launched from the DXBinteract supply pipeline based on the DLD project registry (retrieved 10 Nov 2026).
The 2025 median of AED 1,671 per square foot was an all-time high, 94.5% above the 2012 low, and 2021–2025 were five consecutive years of gains. Over the full 2014–2025 cycle, however, the compound growth rate was only 4.2% a year, a reminder that buying near a peak can wipe out much of a boom’s gains. Knight Frank estimates average residential values rose about 83% over five and a half years.
Late-boom signals that appeared in 2024 and 2025
Three classic peak signals built up. Launches nearly doubled, from 91,858 units in 2023 to 169,266 in 2024. Off-plan sales reached about 68% of all sales in 2025. And price growth slowed each year after 2022, from +19.8% to +8.8%. Our Dubai real estate market statistics track these series month by month.
Is Dubai's property market in a correction in 2026?
Yes, a moderate one. Valuations fell about 10% in the months after the regional conflict began on 28 February 2026, registered prices are now slightly below a year ago, and sales volumes are down around 40%.
ValuStrat, whose RICS valuers reassess a fixed basket of homes each month, measured a cumulative 10% fall from 28 February to June. By end-September its index stood at 218.6 points, 4.5% lower year on year: the first annual decline since the pandemic. Cavendish Maxwell had already recorded a 1.7% annual fall in August, to AED 1,636 per square foot, the first since February 2021. In the prime segment, Knight Frank reported a 5% drop in prices between the second and third quarters.
| Month | Median AED/sq ft | Sales | Value of sales |
|---|---|---|---|
| Oct 2025 | 1,703 | 19,856 | AED 59.2bn |
| Jan 2026 | 1,816 | 17,295 | AED 71.8bn |
| Apr 2026 | 1,824 | 14,074 | AED 48.5bn |
| May 2026 | 1,655 | 10,298 | AED 29.1bn |
| Jul 2026 | 1,691 | 14,243 | AED 35.4bn |
| Sep 2026 | 1,656 | 11,340 | AED 29.7bn |
| Oct 2026 | 1,639 | 11,937 | AED 34.0bn |
Source: DXBinteract analysis of Dubai Land Department sale registrations, all property types, ready and off-plan (retrieved 10 Nov 2026). October 2026: −3.8% per sq ft and −40% in sales year on year. Monthly medians vary with the mix of homes sold.
A volume-led correction
The pattern resembles 2015–2019 more than 2009: transactions have fallen much faster than prices. Off-plan registrations dropped 45.7% year on year in the third quarter, according to ValuStrat, while ready-home prices held up better. Rents are also turning: new apartment leases signed in October 2026 were 6.3% cheaper than a year earlier. For the full picture, see our Dubai real estate market report.
What makes the 2026 cycle different from 2008?
The 2026 downturn hits a market with far less speculation and much stronger developers than in 2008, which is why most analysts expect a correction rather than a crash.
| Indicator | 2008–09 cycle | 2025–26 cycle | Source |
|---|---|---|---|
| Homes resold within 12 months | 25% (2008 boom) | 4% (2025) | Knight Frank |
| Developer average leverage | n/a | 1.4x in 2025 vs 4.8x in 2020 | Moody’s (Gulf News, Sep 2025) |
| Price fall | Up to 40–50% | About −10% Feb–Jun 2026; −4.5% YoY to Sep | Fitch; ValuStrat |
| Bank exposure | n/a | Corporate real estate 13% of UAE bank loans; retail mortgages ~10% (end-2025) | Fortune, 1 Jun 2026 |
| Population | n/a | 4,807,185 on 29 Sep 2026, +226,885 since January | Dubai Data and Statistics Establishment |
Sources as listed, 2025–2026. n/a: no comparable figure in the sources we verified.
Where the risks still lie
The main risk this time is supply, not leverage. Developers have announced 122,604 units for delivery in 2027 and 116,541 in 2028, roughly two and a half times the 46,186 delivered in 2025. Moody’s warned in May 2026 that a slowdown in population inflows would worsen the absorption risk, and Fitch, which forecast a 15% decline from July 2025 to end-2026 before the conflict, now expects a larger correction. UBS rated Dubai’s bubble risk “elevated” in September 2026, with a score of 1.16, but noted that “an improvement in the geopolitical environment is likely to support a rapid recovery.”
Which indicators tell you where Dubai is in the property cycle?
No single number identifies the phase. Watch a handful of indicators together, and look at their direction over several months rather than one data point.
The most useful indicators are published monthly or quarterly by the Dubai Land Department, valuers such as ValuStrat, and consultancies. Stock market indices of listed developers move much faster than physical prices, as our guide to the Dubai real estate index explains: the DFM real estate index fell about 20% between 27 February and 9 March 2026, far more than home values.
- Sales volumes. Volumes usually turn before prices. Monthly sales fell from about 20,000 in late 2025 to 11,000–14,000 from mid-2026.
- Price per square foot and valuation indices. Compare registered medians with a repeat-valuation index such as ValuStrat's to separate real price moves from changes in mix.
- Launches and the delivery pipeline. Surging launches signal a late boom; heavy deliveries two to four years later test demand.
- Off-plan share of sales. About 68% in 2025 and roughly 70% in 2026; a very high share means more of the market depends on future buyers.
- New-lease rents versus renewals. New leases react first. In October 2026 they fell 6.3% while renewals still rose 4.9%.
- Resale discounts on off-plan units. Practitioners quoted by Fortune reported off-plan resales 10–15% below original prices in many cases in 2026.
- Population and policy. Population inflows and visa rules drive demand; Dubai has removed the AED 750,000 minimum for the two-year property residency visa.
Where is Dubai in the cycle now, and how should you invest at each phase?
As of November 2026, Dubai is in an early-to-mid correction: volumes are well down, prices are a few percent below their 2025 highs, and the largest wave of new supply is still ahead in 2027–2028.
| Phase | Typical signals | Dubai example | Investor approach |
|---|---|---|---|
| Boom | Volumes and prices up, launches surge | 2021–2025 | Buy early in the boom; favour quality locations; avoid paying peak launch prices late in the run |
| Peak | Growth slows, launches at record, speculation | 2014; 2025 | Take profits on weaker assets; avoid stretched off-plan purchases |
| Correction | Volumes fall, prices slip, discounts appear | 2009; 2015–2020; 2026 | Negotiate hard; target ready homes with proven rents; keep cash reserves |
| Recovery | Prices stabilise, rents firm, volumes return | 2012–2013; 2021 | Buy before prices confirm the upturn; established communities first |
Source: Valorisimo analysis based on DLD price series (DXBinteract, retrieved 10 Nov 2026) and the sources cited in this article.
Investing during a correction
A correction is often the best time for patient buyers with cash or secure financing. Sellers negotiate, developers offer better payment plans and the risk of paying a peak price falls. Focus on assets that will hold value through a supply wave: ready homes with verified rents, waterfront and villa communities, and buildings with little competing supply. Our list of top capital appreciation areas in Dubai shows which areas held up best in 2026.
Watch out
Cycle phases are only clear in hindsight, and Dubai's cycles are heavily influenced by geopolitics and global capital flows. Medians shift with the mix of homes sold, and announced delivery dates often slip. Use cycle analysis to set expectations and negotiating stance, not to time the exact bottom.
Frequently asked questions
What are the phases of the UAE real estate cycle?
There are four: boom (prices, volumes and launches rise), peak (growth slows and supply builds up), correction (prices and volumes fall) and recovery (prices stabilise and demand absorbs supply). Dubai went through all four between 2012 and 2025.
How much did Dubai property prices fall in 2008–09?
By roughly half. Cluttons measured a 49.7% fall in Dubai values after the recession, and Gulf News reported prices dropped by half in less than a year from the late-2008 peak. In mid-2013 prices were still 31.1% below their 2008 highs.
Is Dubai property in a correction in 2026?
Yes, a moderate one. ValuStrat recorded a 10% fall in valuations from late February to June 2026 and a 4.5% annual decline by September. DLD data show October 2026 prices 3.8% lower and sales 40% lower than a year earlier.
Will Dubai have another crash like 2009?
Most indicators argue against a repeat. Only 4% of homes were resold within 12 months in 2025 versus 25% in 2008, and developer leverage fell to 1.4x in 2025 from 4.8x in 2020. The main risk is the 122,604 units announced for 2027.
When is the best time to buy in a property cycle?
Usually late in a correction or early in a recovery, when sellers negotiate and prices have not yet confirmed the upturn. In practice, timing the exact bottom is difficult: buying quality assets with proven rents during a correction is a more reliable approach.
Figures are indicative as of the date shown: check them with official sources before any decision.
- For information only; this is not tax, legal or financial advice.