Top Capital Appreciation Areas in Dubai 2026
- Published 14 Mar 2026
- Updated 10 November 2026
- 11 min read
- Data verified on 10 Nov 2026
In short
In 2026 Dubai prices are correcting overall: ValuStrat’s index was 3.1% lower year on year in August and 10.2% below February. A few areas still rose. On DLD-based DXBinteract data, Dubai Islands apartment prices per sq ft are up 18.4% year on year, Jabal Ali First 14.2%, Arjan 10.6% and JVT 9.5%. Among established communities, ValuStrat ranks Jumeirah Islands villas first at +12.2%. Waterfront scarcity and new metro lines are the main long-term drivers.
ValuStrat Price Index, August 2026 · DXBinteract (DLD-based), retrieved 10 Nov 2026
+18.4%per sq ft, YoY
Dubai Islands apartments, fastest-rising area in this guide
Source: DXBinteract, retrieved 10 Nov 2026
−10.2%since February
Dubai citywide capital values, August 2026
Source: ValuStrat, Aug 2026
−5%quarter on quarter
Prices in Dubai’s 10 prime neighbourhoods, Q3 2026
Source: Knight Frank, Q3 2026
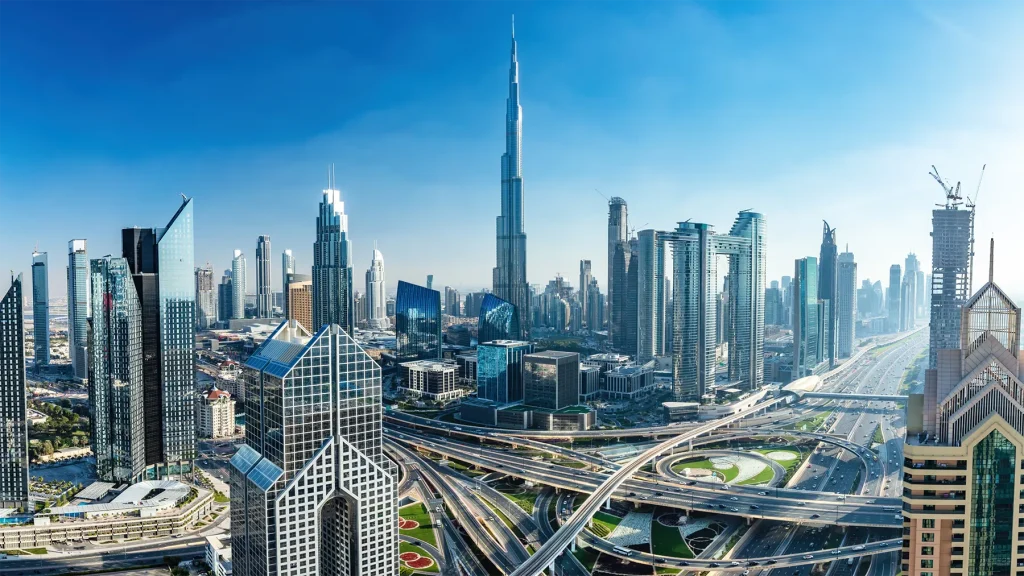
Waterfront districts led Dubai’s capital appreciation in a correcting 2026 market.Photo: © VALORISIMO
Which Dubai areas show the strongest capital appreciation in 2026?
In a year when Dubai’s average values fell, appreciation became selective. The areas that still gained are either new waterfront districts with limited supply or mid-market communities where demand outpaced deliveries.
The table below uses DXBinteract’s statistics, built on Dubai Land Department registrations. It compares the median apartment price per square foot with the same window a year earlier. Read it with the off-plan column in mind: in areas that are mostly off-plan, a rising median can reflect newer, more expensive launches as much as genuine resale gains.
| Area (apartments) | Price per sq ft (AED) | Price/sq ft, YoY | Sales, YoY | Off-plan units / total units |
|---|---|---|---|---|
| Dubai Islands | 2,780 | +18.4% | +22.6% | 15,156 / 16,238 |
| Jabal Ali First | 1,520 | +14.2% | −4.0% | 19,446 / 58,085 |
| Arjan | 1,520 | +10.6% | −17.7% | 9,002 / 28,792 |
| Jumeirah Village Triangle | 1,660 | +9.5% | −24.8% | 13,377 / 21,391 |
| Dubai Maritime City | 3,190 | +7.0% | −23.1% | 13,352 / 15,139 |
| Dubai Creek Harbour | 2,560 | +5.7% | +4.3% | 7,379 / 20,143 |
| Mina Rashid | 2,840 | +0.7% | −41.9% | 4,387 / 5,255 |
| Dubai (all apartments) | 1,730 | +1.1% | −16.0% | 480,465 / 1,172,505 |
Source: DXBinteract location statistics (DLD-based registrations), apartments, latest rolling window with year-on-year change, retrieved 10 Nov 2026. Mina Rashid = Rashid Yachts & Marina master project.
Dubai Islands stands out on every measure: price per sq ft, sales volumes (+22.6%) and value of sales (+40.7%) all rose while the citywide apartment market saw 16% fewer sales. Jabal Ali First, Arjan and JVT show that well-located mid-market areas can still appreciate. Dubai Maritime City and Mina Rashid show high prices but falling volumes, a sign that buyers became more selective at the top of the market.
What happened to Dubai property prices in 2026?
After several years of strong growth, Dubai entered its first annual price decline since the pandemic in 2026. The fall was sharp in spring and flattened out over the summer.
Mainstream market
ValuStrat’s Q2 2026 review shows monthly falls of 6% in March, 2% in April and 1% in May and June, about 10% in total since late February, which it links to regional disruptions, with stabilisation after the 8 April ceasefire. By August, the citywide index stood at 218.8 points, 3.1% lower year on year. Apartments were down 5.3% and villas 1.7%, the first annual fall for villas since 2021. Even so, 73% of villa communities and 61% of apartment communities were stable in the month.
Prime market
| Prime indicator | Q3 2026 |
|---|---|
| Prices, 10 prime neighbourhoods | −5% quarter on quarter (first fall since 2020) |
| Prime transaction volumes | −29.4% year on year |
| Palm Jumeirah price | AED 4,083 per sq ft, −9.1% over 12 months |
| Sales of US$10m+ | 86 in Q3; 412 in the first nine months vs 357 a year earlier |
Source: Knight Frank Q3 2026 data, via Khaleej Times, 21 Oct 2026.
Knight Frank’s Q3 data shows the prime segment cooling too, although sales of homes above US$10 million are still ahead of last year over nine months. Palm Jumeirah, the benchmark luxury address, is described by Knight Frank as “increasingly offering good value”.
Activity has not collapsed
Dubai still registered AED 574.12 billion of real estate transactions across 165,018 deals in the first nine months of 2026 (Emirates 24|7), the second-highest sales value on record. For a long-term investor, a correction in a liquid market is a better entry point than the top of a cycle. Track the monthly moves in our Dubai real estate index guide.
What drives capital appreciation in Dubai real estate?
Over a five to ten year horizon, four forces explain most of Dubai’s price outperformance: scarce waterfront land, transport, master-planned communities and the depth of international demand.
Limited waterfront supply
Beachfront and marina land is finite, which is why waterfront villa communities lead long-term gains. ValuStrat notes that older freehold villa communities are 187% above post-pandemic levels and 75% above the 2014 peak, while older freehold apartments are 9% below their 2014 peak.
New metro lines
The Metro Blue Line (30 km, 14 stations, AED 20.5 billion) is due on 9 September 2029 and will serve Dubai Creek Harbour, Dubai Silicon Oasis, Mirdif and International City. The Gold Line (42 km underground, 18 stations, AED 34 billion) is due on 9 September 2032, from Al Ghubaiba to Jumeirah Golf Estates via Mina Rashid, Business Bay, Meydan, Al Barsha South and JVC, with future Etihad Rail links at Meydan and Jumeirah Golf Estates.
Airport and logistics
Al Maktoum International Airport is the largest long-term catalyst for the south of the city. Dubai Airports said in August 2026 that AED 13 billion of construction is under way, with more than AED 55 billion of contracts to award by the end of 2026 and a first phase opening in 2032.
Master-planned communities
Large single-developer districts with promenades, retail, parks and schools tend to hold value better than isolated towers, because the developer controls the pace of supply and the quality of public spaces.
Is Dubai Islands the best capital growth play in 2026?
Dubai Islands is the fastest-rising area in this guide and one of the few districts where sales volumes grew in 2026.
DXBinteract records 4,565 apartment sales, up 22.6% year on year, a median price of AED 2,851,000 and a median of AED 2,780 per sq ft, up 18.4%. Developer (primary) sales have averaged AED 2,510 per sq ft, below the current median, so many early buyers show paper gains.
The district is still at an early stage: of 16,238 apartment units tracked, 15,156 are off-plan, and only a handful are rented. Beaches, beach clubs, parks and cycling paths are planned along the coast, with road links to Deira and the airport. The Dubai Islands area guide lists the active projects.
The risk
Gains are largely on paper until handovers. Thousands of units will complete over a short period, and resale prices at handover will depend on how many buyers want to exit at the same time.
Do Dubai Maritime City and Mina Rashid still have upside?
Both districts sit between Downtown and the old port, with marina living and fast access to DIFC and Sheikh Zayed Road. Both are already priced at the top of the market.
Dubai Maritime City
DXBinteract shows a median apartment price of AED 2,448,000 and AED 3,190 per sq ft, up 7.0% year on year, but sales volumes fell 23.1%. 13,352 of 15,139 apartment units are off-plan, so the district will change character as it delivers. See the Dubai Maritime City area guide.
Mina Rashid
In the Rashid Yachts & Marina master project, DXBinteract shows AED 2,840 per sq ft, almost flat (+0.7%) year on year, with sales down 41.9%. The upside case rests on the Gold Line, which lists Mina Rashid among its stations for 2032, and on the marina and cruise-terminal setting.
What about Dubai Creek Harbour and Meydan?
These two districts are the main beneficiaries of Dubai’s new metro lines and are often presented as the city’s next central business and residential hubs.
Dubai Creek Harbour
Creek Harbour is the most balanced of the waterfront growth areas: DXBinteract shows sales up 4.3%, a median of AED 2,560 per sq ft, up 5.7%, and a median rent of AED 130,000, with 5,453 units already rented. Property Monitor puts its apartment gross yield at 5.12% (August 2026). The Blue Line will serve the district from 2029. Read the Dubai Creek Harbour area guide.
Meydan
Meydan’s 2026 statistics are distorted by a surge of new launches: DXBinteract shows sales up more than fourfold year on year, while the median price per sq ft and the median price move in opposite directions. That is a change in what is being sold, not a reliable appreciation signal. The long-term case rests on the Gold Line station and a future Etihad Rail station at Meydan, plus access to Al Khail Road and Sheikh Mohammed bin Zayed Road. See the Meydan area guide.
Which established communities held their value best in 2026?
ValuStrat’s index follows the same homes over time, so it is a cleaner measure of appreciation for completed communities than median sales prices.
| Area | Type | Capital value change, 12 months to Aug 2026 |
|---|---|---|
| Jumeirah Islands | Villas | +12.2% |
| Emirates Hills | Villas | +7.4% |
| The Villa | Villas | +5.0% |
| The Meadows | Villas | +4.8% |
| Dubai Silicon Oasis | Apartments | +4.3% |
| Dubai Sports City | Apartments | +4.2% |
| Al Quoz Fourth | Apartments | +3.9% |
| Palm Jumeirah | Villas / apartments | −6.2% / −8.6% |
| Town Square | Apartments | −9.7% |
| Jumeirah Beach Residence | Apartments | −16.9% |
| Burj Khalifa district | Apartments | −20.4% |
| Dubai citywide | All residential | −3.1% |
Source: ValuStrat Price Index, August 2026, via Khaleej Times, 9 Sep 2026.
Two patterns stand out. Low-density villa communities with no new supply, such as Jumeirah Islands and Emirates Hills, kept rising. High-rise apartment districts with a lot of investor stock, such as the Burj Khalifa district and JBR, took the largest falls. Among affordable areas, Dubai Silicon Oasis and Dubai Sports City gained, helped by strong rental demand. For income-led areas, see our guide to the top rental yield areas in Dubai.
How should you invest for capital growth in Dubai in 2026?
The 2026 correction rewards patient buyers who pay for location and scarcity, not for marketing.
- Separate real and mix-driven gains. In off-plan districts, compare resale prices for the same unit types, not area medians.
- Buy scarcity. Waterfront and low-density villa communities have led over the long term.
- Follow the stations. Blue Line (2029) and Gold Line (2032) catchments are where infrastructure adds value.
- Check the handover wave. Count units completing in your area in the two years after your own handover.
- Keep a long horizon. Plan to hold for five years or more and model a flat first year.
- Use the discount. With values about 10% below February on ValuStrat, negotiate on ready units.
Watch out
In off-plan districts, much of the appreciation is unrealised until handover, and a large volume of completions can push resale prices down. Past growth figures do not guarantee future gains.
Frequently asked questions
Which Dubai area has the highest capital appreciation in 2026?
On DLD-based DXBinteract data retrieved in November 2026, Dubai Islands leads, with apartment prices per sq ft up 18.4% year on year. Among completed communities tracked by ValuStrat, Jumeirah Islands villas rose 12.2% in the 12 months to August 2026.
Are Dubai property prices falling in 2026?
Yes, on average. ValuStrat’s index was 3.1% lower year on year in August 2026 and 10.2% below February. Knight Frank recorded a 5% quarterly fall in prime prices in Q3 2026. Some areas still rose.
Is off-plan the best way to capture capital growth in Dubai?
Off-plan offers lower entry prices and staged payments, and districts like Dubai Islands show strong gains. But gains are unrealised until handover, and large completion waves can weigh on resale prices. Check the developer’s delivery record and escrow registration.
Which infrastructure projects will boost Dubai property values?
The Metro Blue Line (2029) serving Dubai Creek Harbour and Dubai Silicon Oasis, the Gold Line (2032) serving Mina Rashid, Business Bay, Meydan, Al Barsha South and JVC, and Al Maktoum International Airport, whose first phase is due in 2032.
How long should you hold Dubai property for appreciation?
Plan for at least five years. The 2026 correction shows that values can fall in a single year, while ValuStrat data shows older freehold villa communities 75% above their 2014 peak over the long run.
Figures are indicative as of the date shown: check them with official sources before any decision.
- For information only; this is not tax, legal or financial advice.