
Dubai Real Estate Index 2026: DFM Shares vs Real Property Prices
- Published 26 Mar 2026
- Updated 10 November 2026
- 12 min read
- Data verified on 10 Nov 2026
In short
The Dubai real estate index most quoted in 2026, the DFM Real Estate Index, tracks developer shares, not home prices. It fell about 20% between 27 February and 9 March 2026 as regional conflict hit markets. Actual home values moved far less: ValuStrat’s valuation index fell 10% from late February to June and stood 4.5% lower year on year in September, while the DLD median sale price reached AED 1,639 per sq ft in October 2026, down 3.8% on a year earlier.
Sherwoods and Whalesbook analyses of DFM data, Mar–Apr 2026 · ValuStrat Q2 and Q3 2026 reviews · DXBinteract analysis of DLD records, Oct 2026
~−20%DFM real estate index
Fall from 27 February to 9 March 2026, after the regional conflict began
Source: Sherwoods and Whalesbook analyses of DFM data, Mar–Apr 2026
−4.5%home values, YoY
ValuStrat residential index at 218.6 points, end of September 2026
Source: ValuStrat Q3 2026 review
AED 1,639per sq ft
Median price of all registered sales in October 2026, −3.8% year on year
Source: DXBinteract / DLD records, Oct 2026
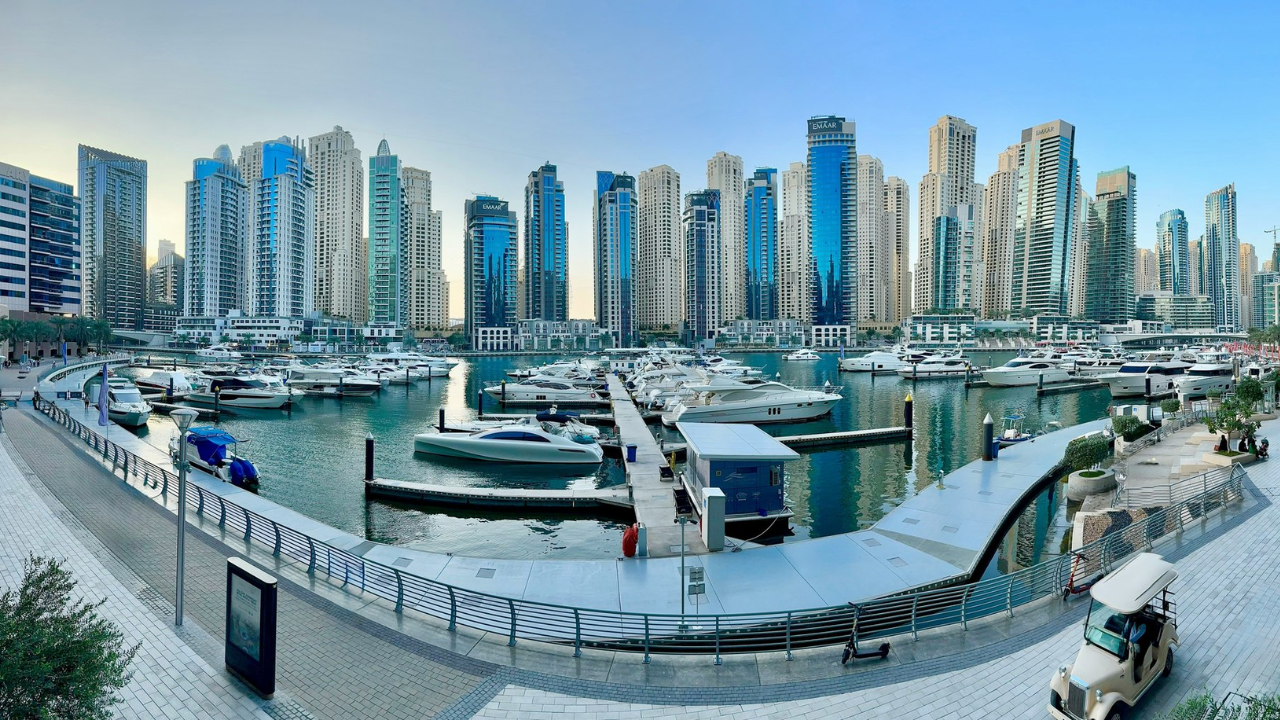
Share prices and home prices in Dubai moved on very different clocks in 2026.Photo: © VALORISIMO
In this article · 9 sections
What is the Dubai real estate index?
When people say “the Dubai real estate index”, they usually mean one of two very different things: a stock-market index of listed developers, or a measure of what homes actually sell for. In 2026 the gap between the two became the whole story.
The DFM Real Estate Index tracks the share prices of property companies listed on the Dubai Financial Market, led by Emaar Properties. It moves every second the market is open and reflects what investors think those companies will earn. It does not record a single villa or apartment sale.
Property prices are measured elsewhere. The Dubai Land Department (DLD) registers every sale, and several research firms turn that raw data, or professional valuations, into price indices. ValuStrat publishes a valuation-based index (the VPI); Property Monitor, Cavendish Maxwell and REIDIN track averages or medians of registered deals; Knight Frank follows ten prime neighbourhoods. DXBinteract, which analyses DLD registrations, gives a median price per square foot for every month.
Which indicators to watch in late 2026
None of these is “the” index. Each answers a different question, and the table below shows where each one stood at its latest reading.
| Indicator | What it measures | Latest reading | Period |
|---|---|---|---|
| DFM general index | Share prices of all companies listed on the Dubai Financial Market | 6,051.23 points | 5 Nov 2026 |
| Emaar Properties share | Largest listed developer, the heaviest weight in the DFM real estate sector | AED 12.52, about −11% year to date | 5 Nov 2026 |
| ValuStrat Price Index (VPI) | RICS valuations of a fixed basket of homes (Jan 2021 = 100) | 218.6 points, −4.5% year on year | End Sep 2026 |
| Median sale price per sq ft (DLD records) | All registered sales, ready and off-plan | AED 1,639, −3.8% year on year | Oct 2026 |
| Cavendish Maxwell average price | Average sale price of homes sold | AED 1,636 per sq ft, −1.7% year on year | Aug 2026 |
| Knight Frank prime index | 10 prime neighbourhoods | −5% quarter on quarter | Q3 2026 |
Source: Gulf News (5 Nov 2026); ValuStrat Q3 2026 review via The Arabian Post (29 Oct 2026); DXBinteract analysis of Dubai Land Department records (retrieved 10 Nov 2026); Cavendish Maxwell via Zawya (Aug 2026); Knight Frank via Khaleej Times (21 Oct 2026).
The rule of thumb is simple. If you want to know how investors feel about Dubai developers, watch the DFM. If you want to know what your apartment is worth, look at DLD-based prices for your building and community, not at a share chart.
What happened to the DFM real estate index in 2026?
The DFM real estate sector had one of its sharpest falls in a decade at the start of March 2026, when regional conflict reached the Gulf.
After Iranian missile and drone attacks across the region, the UAE Capital Market Authority closed the Dubai Financial Market and the Abu Dhabi exchange on 2 and 3 March. Trading resumed on 4 March with a temporary lower limit of 5% per day. The main Dubai index fell 4.7% intraday, its steepest drop since May 2022, and Emaar Properties lost 4.9%.
Selling continued for several sessions. According to an analysis of DFM data by Sherwoods, the DFM Real Estate Index lost roughly 20% between its 27 February peak and 9 March, in under two weeks. By mid-April, Emaar shares had fallen from about AED 17.25 to near AED 11.20, and some commentators described a 30% collapse of the real estate index.
The rebound
The recovery started as fast as the fall. The real estate index posted its biggest one-day gain since 2014 on 8 April, after a ceasefire. By early November, Emaar’s nine-month results (net profit up 17% to AED 17.1 billion) and its AED 15 per share cash offer for the rest of Emaar Development lifted the sector 4.2% in a single session. Emaar closed at AED 12.52 on 5 November, still about 11% lower than at the start of the year.
| Date | Event | Move |
|---|---|---|
| 27 Feb 2026 | DFM Real Estate Index pre-conflict peak | Peak |
| 2–3 Mar 2026 | DFM and ADX closed by the Capital Market Authority | No trading |
| 4 Mar 2026 | Reopening with a temporary −5% daily limit | DFM index −4.7% intraday; Emaar −4.9% |
| 9 Mar 2026 | DFM Real Estate Index low point of the first leg | About −20% from peak |
| Mid-April 2026 | Emaar shares near their trough | About AED 11.20, from about AED 17.25 in late February |
| 8 Apr 2026 | Ceasefire rally | Biggest daily gain since 2014 for the real estate index |
| 4–5 Nov 2026 | Emaar results and AED 15 per share offer for Emaar Development | Real estate sector +4.2%; DFM index 6,051.23 |
Source: The Star / Reuters (4 Mar 2026); Sherwoods analysis of DFM data (Apr 2026); BusinessToday (18 Apr 2026); Gulf News (5 Nov 2026).
Those moves happened in days. As the next section shows, home values moved in the same direction but far less, and far more slowly.
Did Dubai property prices actually fall in 2026?
Yes, but modestly: Dubai home values are down by mid-single digits from their peak, not by the 20–30% seen on the stock market.
ValuStrat’s valuation index is the fastest price gauge, because its RICS valuers re-mark the same homes every month instead of waiting for registrations. It recorded a 6% fall in March, then 2% in April and 1% in each of May and June: a cumulative 10% drop since late February. By the end of September the index stood at 218.6 points, 4.5% below a year earlier, which ValuStrat called the first annual fall in its citywide index since the pandemic.
| ValuStrat reading | Value | Change |
|---|---|---|
| Monthly falls, March to June 2026 | −6%, −2%, −1%, −1% | Cumulative −10% since late February |
| Residential VPI, Q2 2026 | 220.0 points | −4% QoQ, +0.1% YoY |
| Villa VPI, Q2 2026 | 293.7 points | −4.2% QoQ |
| Apartment VPI, Q2 2026 | 169.1 points | −3.7% QoQ, −3% YoY |
| Residential VPI, end September 2026 | 218.6 points | −4.5% YoY |
| Prime villa sub-index, September 2026 | n/a | +1.2% YoY |
| Average resale price, Q3 2026 | AED 1,627 per sq ft | −4.4% QoQ, −1.5% YoY |
Source: ValuStrat Dubai Real Estate Review Q2 2026 (Zawya) and Q3 2026 (The Arabian Post, 29 Oct 2026).
What registered sales say
DLD registrations tell the same story with a lag. The median price per square foot of all sales peaked at AED 1,824 in April 2026, partly because registrations then still reflected deals agreed before the conflict. It eased to AED 1,639 in October, 3.8% below October 2025 and about 10% below the April level. Cavendish Maxwell’s August reading (AED 1,636 per sq ft, −1.7% year on year) was the first annual decline in average prices since February 2021.
| Month | Median price per sq ft | Sales registered | Sales value |
|---|---|---|---|
| October 2025 | AED 1,703 | 19,856 | AED 59.2bn |
| December 2025 | AED 1,816 | 18,672 | AED 63.4bn |
| February 2026 | AED 1,788 | 17,112 | AED 61.3bn |
| March 2026 | AED 1,799 | 13,539 | AED 43.6bn |
| April 2026 | AED 1,824 | 14,074 | AED 48.5bn |
| May 2026 | AED 1,655 | 10,298 | AED 29.1bn |
| June 2026 | AED 1,695 | 14,107 | AED 34.1bn |
| August 2026 | AED 1,689 | 12,081 | AED 28.9bn |
| September 2026 | AED 1,656 | 11,340 | AED 29.7bn |
| October 2026 | AED 1,639 | 11,937 | AED 34.0bn |
Source: DXBinteract analysis of Dubai Land Department sale registrations, all property types, ready and off-plan (retrieved 10 Nov 2026). Medians move with the mix of units sold each month.
So the honest answer is two-sided. Overall, prices are a little lower than a year ago, after five and a half years in which Knight Frank estimates average residential values rose by about 83%. Locally, some buildings and communities have corrected far more, which is where opportunities and risks both sit.
Why can the share index fall faster than home prices?
A share price is a bet on future profits; a home price is a negotiated deal on one unit. They react on different clocks.
When a shock hits, a fund manager in London can sell Emaar shares in seconds. A homeowner in Dubai Hills who does not need to sell simply waits. Developer shares also price in what happens to future launches: if buyers hesitate for a quarter, a developer’s new sales and cash flow fall at once, even if existing homes hold their value. Emaar’s own figures show this: its nine-month sales were AED 34.7 billion and its backlog still grew 6% to AED 158.8 billion, yet the share price stayed below January levels.
| Listed developer shares (DFM) | Physical homes (DLD) | |
|---|---|---|
| Reaction time | Minutes to days | Weeks to months |
| What is priced | Expected future profits of a company | One unit, its location and condition |
| Who sets the price | Funds and traders, many foreign | Buyers and sellers, many owner-occupiers |
| Liquidity | Can be sold instantly | Weeks to agree, then registration |
| 2026 low point vs February | Real estate index about −20% by 9 March | Valuations about −10% by June (ValuStrat) |
Source: Valorisimo comparison; figures from Sherwoods analysis of DFM data (Apr 2026) and ValuStrat Q2 2026 review.
Liquidity and leverage
Two more factors widen the gap. Listed shares are fully liquid, so they absorb all the selling pressure; homes are not, so sellers who must sell cut prices while others withdraw. And Dubai’s market is less leveraged than in 2008: Knight Frank notes that only 4% of homes sold last year were resold within 12 months, against 25% during the 2008 boom. Fewer forced sellers means smaller price falls.
Which areas and segments fell, and which held up?
The 2026 correction is uneven: apartments softened more than villas, and some mature apartment districts fell more than newer waterfronts.
ValuStrat’s villa index still showed typical villa values up 2% year on year in Q2, with prime villas up 7.1%, while its apartment index was down 3%. Communities such as Jumeirah Islands (+17.9%) and Emirates Hills (+10.7%) kept rising over 12 months to June, while Burj Khalifa district apartments (−16.7%) and Jumeirah Beach Residence (−13%) fell hardest.
Median prices by area
DLD-based medians for the first ten months of each year show the same split. Waterfront districts with new stock, such as Dubai Islands and Palm Jumeirah, rose; older high-rise districts such as Dubai Marina and Jumeirah Lake Towers fell sharply.
| Area (apartments) | Median AED/sq ft Jan–Oct 2025 | Median AED/sq ft Jan–Oct 2026 | Change |
|---|---|---|---|
| Dubai Islands | 2,380 | 2,840 | +19.3% |
| Palm Jumeirah | 2,980 | 3,360 | +12.8% |
| Dubai Creek Harbour | 2,420 | 2,560 | +5.8% |
| Jumeirah Village Circle | 1,460 | 1,450 | −0.7% |
| Downtown Dubai | 2,910 | 2,820 | −3.1% |
| Business Bay | 2,470 | 2,370 | −4.0% |
| Dubai Marina | 2,360 | 1,970 | −16.5% |
| Jumeirah Lake Towers | 1,950 | 1,570 | −19.5% |
Source: DXBinteract analysis of Dubai Land Department records, apartment sales Jan–Oct each year (retrieved 10 Nov 2026). Medians mix ready and off-plan sales; a change in what was sold can move them as much as a change in prices.
Read the bigger moves with care. In Dubai Marina, for example, fewer premium launches and more resales of older towers pull the median down even if a given building lost less. Before acting on any figure, compare like with like: same building, same size, ready or off-plan. Our Dubai Marina area guide and apartment prices in Dubai by area break this down further.
What do transaction volumes say about the market?
Volumes fell far more than prices, which is typical of a market where owners hold rather than sell.
Dubai closed 2025 with a record AED 917 billion of real estate transactions, up 20%. In 2026, the first quarter was still strong (AED 252 billion, +31%), because many deals had been agreed before March. From then on activity slowed: DLD data cited by BusinessToday showed sales down 44% year on year between 28 February and 22 March.
By the end of October, DLD had registered 181,866 transactions worth AED 624.8 billion, about two-thirds of the 2025 total. Sales reached AED 412 billion, of which ready properties made up AED 215.6 billion and off-plan AED 196.4 billion. October alone brought AED 34.1 billion of sales through 11,610 deals, compared with 19,856 sales a year earlier.
A shift from off-plan to resale
The mix is changing too. ValuStrat counted 9,491 resale transactions in Q3 2026, up 18.5% on the second quarter, while off-plan registrations fell for a fourth quarter in a row to 24,375. In October, ready-property sales (AED 21.0 billion) were worth more than off-plan sales (AED 13.1 billion). Buyers in 2026 prefer homes they can see, rent and finance today.
How should investors read the index in late 2026?
Treat the DFM as a sentiment gauge and DLD-based prices as the decision tool. When the two diverge, that gap is where negotiating power appears.
In March and April 2026, sellers who needed cash accepted discounts while the headline index looked far worse than reality. Buyers who checked actual registered prices, unit by unit, could separate a real bargain from a unit that was simply overpriced before. That is the logic behind our Dubai property price drops tracker, which compares asking prices with recent registered deals in the same building.
- Check the right index. DFM for sentiment, ValuStrat for fast valuations, DLD registrations for actual deals.
- Compare like with like. Same building, same size band, ready versus off-plan; area medians can mislead.
- Watch volumes and resale share. Rising resales with stable prices signal a market that is clearing, not collapsing.
- Look at the rent. Gross yields of 6–8% in districts such as Business Bay or Jumeirah Village Circle cushion a price dip.
- Stress-test the exit. About 33,000 homes had been completed by the end of September, and more handovers are due in 2027.
For the area-by-area picture, read our Dubai real estate market report and the guide to top capital appreciation areas in Dubai.
Watch out
Median prices per square foot mix very different units and move with the type of homes sold each month. A 15% drop in an area median does not mean every flat lost 15%, and a rising median can hide falling prices in older buildings. Always check recent registered sales in the exact building before you make or accept an offer.
Frequently asked questions
What is the Dubai real estate index?
The term usually refers to the DFM Real Estate Index, which tracks the share prices of property companies listed on the Dubai Financial Market, led by Emaar. It reflects investor sentiment about developers. Actual home prices are measured by indices built from Dubai Land Department registrations or valuations, such as ValuStrat’s VPI.
Did Dubai property prices crash in 2026?
No. The DFM real estate index fell about 20% in early March 2026, but ValuStrat’s valuation index fell about 10% in total from late February to June, then stabilised. In October 2026 the median registered sale price was AED 1,639 per sq ft, 3.8% lower than a year earlier.
Why did the DFM real estate index fall so fast?
Regional conflict reached the Gulf at the end of February 2026. The exchange closed on 2 and 3 March and reopened with a 5% daily limit. Shares can be sold instantly, so they priced in lower future developer sales at once, while homeowners who did not need to sell simply held.
Which Dubai index best tracks home prices?
For speed, ValuStrat’s monthly valuation index; for actual deals, medians built from DLD registrations, published monthly by data providers such as DXBinteract, Property Monitor or Cavendish Maxwell. For luxury homes, Knight Frank’s prime index covers ten prime neighbourhoods. Each uses a different method, so compare trends rather than levels.
Is late 2026 a good time to buy in Dubai?
It depends on the unit. Volumes are down and resales are up, which gives buyers more room to negotiate, especially on ready apartments in districts with heavy supply. Check recent registered sales in the same building, the rent it can achieve and upcoming handovers nearby before deciding.
Figures are indicative as of the date shown: check them with official sources before any decision.
- For information only; this is not tax, legal or financial advice.
Want to know if a Dubai price drop is a real opportunity?
Read next

Dubai
area-by-area price per sq ft for ready and off-plan homes in 2026.

Dubai
how to spot genuine discounts against registered sales.

Dubai
the districts where rent best cushions a price dip.