
Dubai Real Estate Market Report 2026: Price Per Sqft Trends
- Published 3 Mar 2026
- Updated 10 November 2026
- 11 min read
- Data verified on 10 Nov 2026
In short
Dubai’s 2026 market slowed sharply in volume but only slightly in price. The median sale price was AED 1,639 per sq ft in October 2026, 3.8% below October 2025, while monthly sales fell from 19,856 to 11,937. Over January to October, the DLD recorded AED 624.8 billion of transactions. Ready apartments rose 4.8% per sq ft in 2026 to date, off-plan apartments fell 5.4%, and Dubai Islands (+19.3%) led area gains while Dubai Marina fell 16.5%.
DXBinteract analysis of DLD records, retrieved 10 Nov 2026 · Emirates 24|7 reporting DLD data, Jan–Oct 2026
AED 1,639per sq ft
Median price of all registered sales in October 2026, −3.8% year on year
Source: DXBinteract / DLD records, Oct 2026
AED 624.8bntransactions
Total value registered by the DLD from January to October 2026
Source: Emirates 24|7, DLD data, 31 Oct 2026
+18.5%resales, QoQ
Resale transactions in Q3 2026, as off-plan registrations fell for a fourth quarter
Source: ValuStrat Q3 2026 review
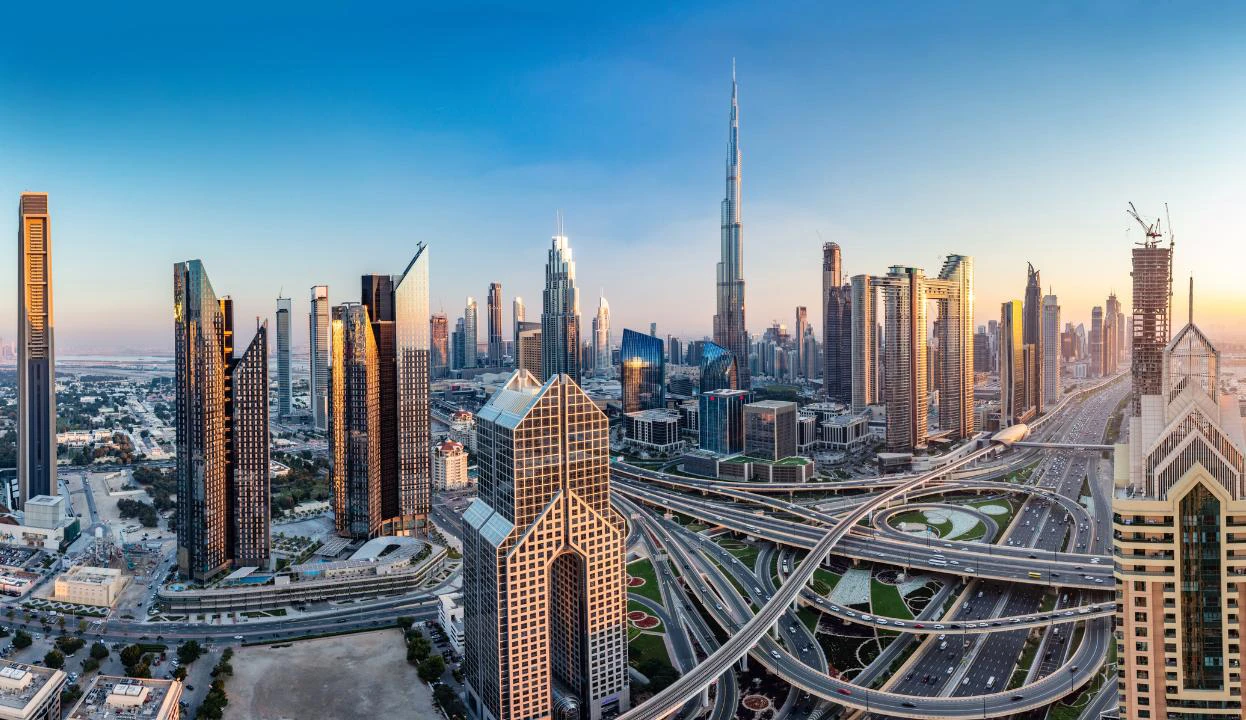
In 2026, Dubai volumes fell much faster than prices.Photo: © VALORISIMO
In this article · 9 sections
How is the Dubai property market performing in 2026?
Dubai’s market in 2026 is a story of two halves: a record-breaking start, then a sharp slowdown in volumes from March, while prices only eased by a few percent.
The emirate entered the year after its best ever twelve months. In 2025, the Dubai Land Department (DLD) recorded more than 270,000 transactions worth AED 917 billion, up 20%, with 129,600 new investors. The first quarter of 2026 extended that run, with AED 252 billion of transactions, up 31%, because most registrations reflected deals agreed in January and February.
The regional conflict that began on 28 February changed the pace. Viewings dropped as flights were disrupted, off-plan launches slowed, and many owners took their homes off the market instead of cutting prices. By the end of October, total transactions stood at AED 624.8 billion, about two-thirds of the 2025 total, and residential sales were running well below last year’s monthly rhythm.
| Period | Total transaction value | Transactions | Note |
|---|---|---|---|
| Full year 2025 | AED 917bn | 270,000+ | Record year, +20% |
| Q1 2026 | AED 252bn | 60,303 | +31% in value, +6% in number |
| H1 2026 | AED 419.9bn | n/a | Sales above AED 286.4bn |
| Jan–Sep 2026 | AED 574.1bn | 165,018 | September: AED 50.8bn, 16,490 deals |
| Jan–Oct 2026 | AED 624.8bn | 181,866 | Sales AED 412.0bn; mortgages AED 163.8bn |
Source: Dubai Media Office (Jan 2026); Dubai Land Department (Apr 2026); Emirates 24|7 reporting DLD data (20 Jul, 1 Oct and 31 Oct 2026). Totals include sales, mortgages and gifts.
Volumes down by about half since the summer
Quarterly figures show the slowdown clearly. Sales of apartments, villas and commercial units fell from 47,820 in Q1 to 29,912 in Q3 2026, about half the 59,340 sales of Q3 2025. Yet the median price per square foot barely moved, from AED 1,707 to AED 1,680.
| Quarter | Sales | Sales value | Median AED/sq ft |
|---|---|---|---|
| Q3 2025 | 59,340 | AED 170.6bn | 1,687 |
| Q1 2026 | 47,820 | AED 175.9bn | 1,707 |
| Q2 2026 | 38,257 | AED 110.4bn | 1,698 |
| Q3 2026 | 29,912 | AED 73.1bn | 1,680 |
Source: fäm Properties quarterly reports based on DXBinteract analysis of DLD records (data retrieved 16 Oct 2026). Apartments, villas and commercial units; land excluded.
This report focuses on what matters for a buyer: price per square foot by segment and by area, and what the shift from off-plan to ready homes means for 2027. For the difference between share-price indices and actual home prices, see our Dubai real estate index explainer.
What is the average price per sq ft in Dubai in 2026?
The median price of a home sold in Dubai was AED 1,639 per sq ft in October 2026, against AED 1,703 a year earlier, a fall of 3.8%.
Over 2026 as a whole, the median of all registered sales is AED 1,718 per sq ft year to date, slightly above the 2025 median of AED 1,671, because the strong first quarter still weighs on the yearly figure. The monthly trend tells the real story: the median peaked at AED 1,824 in April, when registrations still reflected pre-conflict deals, and has drifted lower since.
Other trackers agree on the direction. Cavendish Maxwell put the average sale price at AED 1,636 per sq ft in August 2026, 1.7% below August 2025: its first annual decline since February 2021. ValuStrat’s average resale price was AED 1,627 per sq ft in Q3, down 4.4% on the quarter and 1.5% on the year. Betterhomes, which tracks medians by type, found apartment prices at AED 1,404 per sq ft in September (+2.2% year on year) and villas and townhouses at AED 1,638 (+4.1%), with about two-thirds of its communities still above year-ago levels.
By segment: ready versus off-plan
Splitting the market by type shows where the pressure is. Ready apartments are holding up best, while off-plan apartments, the segment most exposed to investor sentiment and new supply, are the weakest.
| Segment | Median AED/sq ft 2025 | Median AED/sq ft 2026 YTD | Change | Sales 2026 YTD |
|---|---|---|---|---|
| Ready apartments | 1,384 | 1,450 | +4.8% | 30,445 |
| Off-plan apartments | 1,868 | 1,767 | −5.4% | 80,954 |
| Ready villas | 1,723 | 1,670 | −3.0% | 3,802 |
| Off-plan villas | 1,269 | 1,716 | +35.2% | 6,661 |
| All sales | 1,671 | 1,718 | +2.8% | 139,589 |
Source: DXBinteract analysis of Dubai Land Department sale registrations; 2026 is year to date at 10 Nov 2026. The off-plan villa jump reflects a shift towards high-end launches, not a like-for-like price rise.
Different sources give different levels because they measure different things: medians of all deals, averages, valuations or asking prices. Compare trends within one source, and use our apartment prices in Dubai by area page for building-level detail.
Which Dubai areas saw apartment prices rise or fall in 2026?
Waterfront districts with new stock gained, mid-market communities were flat, and older high-rise districts fell most.
The table compares the median price per square foot of apartments sold in the first ten months of 2025 and 2026, with the gross rental yield reported for each area.
| Area (apartments) | Jan–Oct 2025 | Jan–Oct 2026 | Change | Sales Jan–Oct 2026 | Gross yield |
|---|---|---|---|---|---|
| Dubai Islands | 2,380 | 2,840 | +19.3% | 3,678 | 5% |
| Palm Jumeirah | 2,980 | 3,360 | +12.8% | 859 | 6% |
| Dubai Creek Harbour | 2,420 | 2,560 | +5.8% | 3,158 | 7% |
| Dubai South | 1,660 | 1,670 | +0.6% | 13,393 | 8% |
| Jumeirah Village Circle | 1,460 | 1,450 | −0.7% | 8,261 | 8% |
| Dubai Hills Estate | 2,380 | 2,310 | −2.9% | 1,255 | 7% |
| Downtown Dubai | 2,910 | 2,820 | −3.1% | 1,807 | 6% |
| Business Bay | 2,470 | 2,370 | −4.0% | 4,158 | 7% |
| Emaar Beachfront | 4,150 | 3,550 | −14.5% | 309 | 6% |
| Dubai Marina | 2,360 | 1,970 | −16.5% | 1,710 | 7% |
| Jumeirah Lake Towers | 1,950 | 1,570 | −19.5% | 1,143 | 8% |
Source: DXBinteract analysis of Dubai Land Department records, median sale price per sq ft in AED, ready and off-plan apartments combined (retrieved 10 Nov 2026).
Growth corridors
Dubai Islands (+19.3%) and Palm Jumeirah (+12.8%) led the gains, driven by premium beachfront projects. Dubai Creek Harbour (+5.8%) kept rising with steady volumes. Dubai South doubled its number of sales to 13,393, the most of any area in this table, at a stable median of AED 1,670: buyers chased its lower ticket sizes near Al Maktoum airport.
Stabilisation and correction zones
Jumeirah Village Circle, the city’s most traded community, was flat at about AED 1,450 per sq ft and still offers an 8% gross yield. Downtown Dubai (−3.1%), Business Bay (−4.0%) and Dubai Hills Estate (−2.9%) eased modestly. The sharpest falls came in Dubai Marina (−16.5%), Jumeirah Lake Towers (−19.5%) and Emaar Beachfront (−14.5%), where fewer new launches and more resales of older or smaller units pulled medians down.
ValuStrat’s valuation data confirms the pattern: over 12 months to June, DIFC (+8.1%) and Dubai Sports City (+6.6%) apartments rose while Burj Khalifa district (−16.7%) and Jumeirah Beach Residence (−13%) fell. More detail on two contrasting districts is in our Business Bay area guide and Dubai Islands area guide.
How has the off-plan market changed in 2026?
Off-plan still makes up most deals, but its share and its prices have fallen as buyers turn to homes they can rent out immediately.
ValuStrat counted 24,375 off-plan registrations in Q3 2026, down 10.1% on the quarter and 45.7% on the year: the fourth consecutive quarterly fall. Resales went the other way, up 18.5% on the quarter to 9,491. Betterhomes saw the same shift, with secondary sales up 16% to 10,055 and their share of value rising from 30% to 37%.
In October, ready-property sales were worth AED 21.0 billion against AED 13.1 billion for off-plan, according to DLD data reported by Emirates 24|7. Across the first ten months, ready sales (AED 215.6 billion) overtook off-plan (AED 196.4 billion) in value, although off-plan still led in number with 90,760 deals.
What it means for off-plan buyers
The median off-plan apartment price fell 5.4% to AED 1,767 per sq ft in 2026 to date. When comparing launches, weigh the payment plan as well as the list price: a flexible plan only adds value if the developer has a strong delivery record and the instalments match your cash flow. Off-plan premiums over nearby ready stock deserve close scrutiny in districts with heavy handovers due.
How are Dubai villa prices behaving in 2026?
Villas remain the more resilient segment, especially at the top end, though ready villa medians have slipped slightly.
ValuStrat’s villa index stood at 293.7 points in Q2 2026, down 4.2% on the quarter, but the typical villa value of AED 13 million was still 2% higher than a year earlier, and prime villas were up 7.1%. In September its prime villa sub-index remained 1.2% higher year on year even as the citywide index fell 4.5%.
| Area (villas) | Jan–Oct 2025 | Jan–Oct 2026 | Change | Sales Jan–Oct 2026 |
|---|---|---|---|---|
| Emirates Hills | 3,470 | 4,190 | +20.7% | 18 |
| Palm Jumeirah | 6,120 | 7,060 | +15.4% | 61 |
| Dubai Hills Estate | 3,030 | 3,000 | −1.0% | 134 |
| Arabian Ranches 1 | 2,520 | 2,470 | −2.0% | 108 |
Source: DXBinteract analysis of Dubai Land Department records, median sale price per sq ft in AED (retrieved 10 Nov 2026). Small samples: one large sale can move the median.
Where villa demand is strongest
Over 12 months to June, ValuStrat recorded the strongest villa gains in Jumeirah Islands (+17.9%), Emirates Hills (+10.7%) and The Meadows (+10%), while Mudon (−5%), Victory Heights (−4%) and Dubai Hills Estate (−2.8%) softened. In Q3, betterhomes reported quarterly gains of 15.7% for Jumeirah Golf Estates villas and 10.2% for Jumeirah Village Triangle villas. Family buyers who live in their homes keep this segment tighter than the investor-heavy apartment market.
Is Dubai's luxury market still growing in 2026?
Luxury sales hit records in the first half, then slowed in the third quarter, with the first dip in prime prices since 2020.
Knight Frank counted a record 296 sales above US$10 million in H1 2026, worth US$5.1 billion. Activity slowed to 86 such sales in Q3, down from 131 in Q2 and 103 a year earlier, but the nine-month total of 412 sales was still 15% higher than in 2025. Prices across Knight Frank’s ten prime neighbourhoods fell 5% between Q2 and Q3, and Palm Jumeirah averaged AED 4,083 per sq ft, 9.1% lower than a year earlier.
Palm Jumeirah remained the busiest luxury address, with 27 sales above US$10 million in Q3, followed by Jumeirah Second, Emirates Hills, Dubai Hills Estate and Jumeirah Golf Estates. For a detailed ranking, read our guide to the top luxury property investments in Dubai.
What is happening to rents, yields and supply?
Rents have stopped rising and edged down since June, while a large wave of completions is building for 2027.
ValuStrat’s rental index was flat over Q2 2026 and 1.7% higher on the year. Betterhomes then measured median apartment rents 3.8% lower and villa rents 2.3% lower between June and September. Leasing demand remains strong, though: its enquiries hit a record quarter, and Dubai’s population reached 4,807,185 on 29 September, up 226,885 since January.
| Indicator | Value | Period |
|---|---|---|
| ValuStrat rental index | 205.8 points, flat QoQ, +1.7% YoY | Q2 2026 |
| Median apartment rents | −3.8% | June to September 2026 |
| Median villa and townhouse rents | −2.3% | June to September 2026 |
| Median new apartment lease | AED 68,500 a year | 2026 to mid-October |
| Median new villa lease | AED 180,000 a year | 2026 to mid-October |
| Homes completed | About 33,000 | January to September 2026 |
| Homes scheduled for delivery | 136,815 | 2027 |
Source: ValuStrat Q2 2026 review (Zawya) and Q3 2026 review (The Arabian Post); betterhomes Q3 2026 report (15 Oct 2026); fäm Properties / DXBinteract rental data (retrieved 16 Oct 2026).
Yields still attractive in mid-market areas
Gross yields of about 8% in Jumeirah Village Circle, Dubai South and Jumeirah Lake Towers, and around 7% in Business Bay and Dubai Marina, remain high by international standards. The risk is on the supply side: about 33,000 homes were completed in the first nine months of 2026, under a third of the projected full-year total, and 136,815 homes are scheduled for 2027. Late deliveries tend to bunch, so areas with many handovers could see rents soften further. Our top rental yield areas in Dubai guide ranks the districts in detail.
What should investors do with this data going into 2027?
The 2026 market rewards selection over timing: the spread between the best and worst districts is now wider than the citywide price move.
A 3–4% citywide dip hides gains of 10–20% in some waterfront districts and similar falls in some older high-rise areas. Buyers with cash or approved finance now negotiate from a stronger position than at any time since 2020, especially on ready apartments where resale supply is rising.
- Price per sq ft, building by building. Area medians are a starting point; registered sales in the exact tower decide the fair price.
- Prefer ready or near-ready stock where rents can start immediately and the yield cushions further price softness.
- Check the handover calendar for 2027 in your target area before paying an off-plan premium.
- Use villa resilience wisely. Owner-occupier communities have held up better, but entry tickets are higher and yields lower.
- Keep a two- to three-year horizon. Volumes, not prices, absorbed most of the 2026 shock; liquidity can take longer to return.
Watch out
Area medians change with the mix of units sold, and small samples (Emirates Hills, Palm Jumeirah villas) can swing on a handful of deals. The figures here are descriptive, not forecasts. Combine them with the rent a unit can achieve and the supply due nearby before any purchase decision.
Frequently asked questions
What is the average price per sq ft in Dubai in 2026?
The median price of all homes sold in Dubai was AED 1,639 per sq ft in October 2026, according to DXBinteract’s analysis of DLD records, down 3.8% on October 2025. Other trackers are close: Cavendish Maxwell reported AED 1,636 in August and ValuStrat an average resale price of AED 1,627 in Q3.
Are Dubai property prices falling in 2026?
Slightly. ValuStrat’s index was 4.5% lower year on year at the end of September, and the DLD median was 3.8% lower in October. The fall is uneven: older high-rise districts such as Dubai Marina and JLT dropped most, while Dubai Islands, Palm Jumeirah and many villa communities rose.
How many property transactions did Dubai record in 2026?
From January to October 2026, the Dubai Land Department recorded 181,866 transactions worth AED 624.8 billion, including AED 412 billion of sales. October alone brought AED 34.1 billion of sales through 11,610 deals.
Is off-plan or ready property doing better in Dubai?
Ready property. The median ready apartment price rose 4.8% per sq ft in 2026 to date while off-plan apartments fell 5.4%. Resales rose 18.5% in Q3 while off-plan registrations fell for a fourth straight quarter, and ready sales overtook off-plan in value over the first ten months.
Which Dubai areas performed best in 2026?
Among apartment districts, Dubai Islands (+19.3%), Palm Jumeirah (+12.8%) and Dubai Creek Harbour (+5.8%) posted the biggest rises in median price per sq ft between January–October 2025 and 2026. Among villas, Emirates Hills and Palm Jumeirah rose, though on small numbers of sales.
Figures are indicative as of the date shown: check them with official sources before any decision.
- For information only; this is not tax, legal or financial advice.
Want the price per sq ft of a specific building?
Read next

Dubai
why the stock index fell 21% while home values fell far less.
Dubai
the districts with the strongest long-run price growth.
Dubai
where gross yields still reach 7–8%.