
Dubai Real Estate Market Statistics 2026: Sales, Prices and Rents by Month
- Published 18 Feb 2025
- Updated 10 November 2026
- 11 min read
- Data verified on 10 Nov 2026
In short
Dubai’s 2026 property statistics show volumes down sharply, prices down slightly. The Dubai Land Department recorded AED 624.8 billion of transactions from January to October 2026, about two-thirds of 2025’s AED 917 billion. Monthly sales fell from 19,856 in October 2025 to 11,937 in October 2026, while the median sale price eased 3.8% to AED 1,639 per sq ft. January and February 2026 were record months; the slowdown began with the regional conflict on 28 February.
DXBinteract analysis of DLD records, Oct 2025–Oct 2026 · Emirates 24|7 reporting DLD data, Jan–Oct 2026 · Dubai Media Office, 2025
AED 624.8bntransactions
Total value registered by the DLD, January to October 2026
Source: Emirates 24|7, DLD data, 31 Oct 2026
AED 1,639per sq ft
Median price of all registered sales in October 2026, −3.8% year on year
Source: DXBinteract / DLD records, Oct 2026
11,937sales
Sales registered in October 2026, against 19,856 in October 2025
Source: DXBinteract / DLD records, Oct 2026
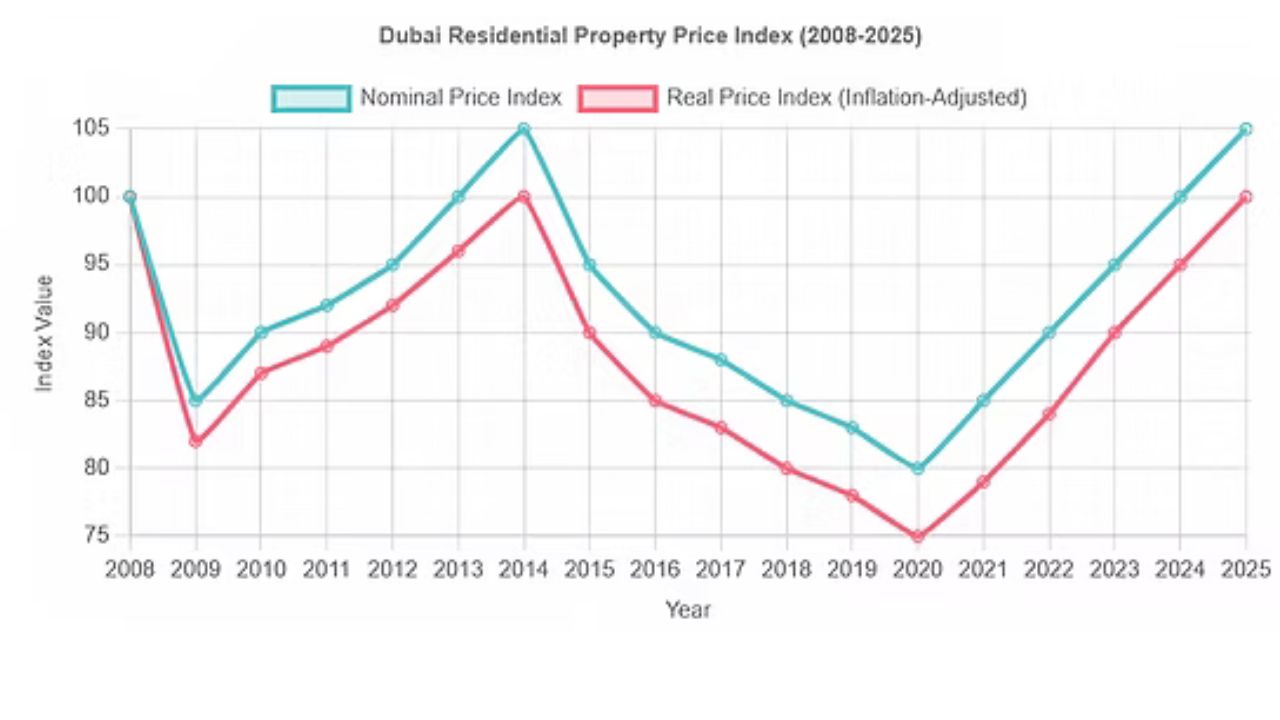
Dubai’s 2026 statistics: fewer sales, prices only slightly lower.Photo: © VALORISIMO
In this article · 9 sections
How has the Dubai property market performed in 2026?
Dubai registered fewer deals in 2026 than in its record 2025, but prices per square foot moved only a few percent. Volumes, not prices, absorbed the shock of the regional conflict that began on 28 February.
The Dubai Land Department (DLD) recorded more than 270,000 transactions worth AED 917 billion in 2025, up 20%. The first quarter of 2026 started even stronger, at AED 252 billion (+31%), because most registrations still reflected deals agreed in January and February. From March, viewings and launches slowed. By the end of October, DLD had registered 181,866 transactions worth AED 624.8 billion, about two-thirds of the 2025 total.
| Period | Transaction value | Transactions | Note |
|---|---|---|---|
| Full year 2025 | AED 917bn | 270,000+ | Record year, +20% |
| Q1 2026 | AED 252bn | n/a | +31% in value |
| H1 2026 | AED 419.9bn | n/a | Sales above AED 286bn |
| Jan–Oct 2026 | AED 624.8bn | 181,866 | Sales AED 412.0bn; mortgages AED 163.8bn |
Source: Dubai Media Office (Jan 2026); Dubai Land Department (Apr 2026); Emirates 24|7 reporting DLD data (20 Jul and 31 Oct 2026). Totals include sales, mortgages and gifts.
Sales only: the headline series
Sales registrations are the cleaner measure for investors, because they exclude mortgages and gifts. On that basis, Dubai recorded 139,589 sales worth AED 427.4 billion in 2026 up to 10 November, at a median of AED 1,718 per sq ft. That median is still 2.8% above the 2025 level of AED 1,671, because the strong first months weigh on the yearly figure. The median ticket, however, fell 8.5% to AED 1.42 million, as buyers moved to smaller and cheaper units.
| Year | Median AED/sq ft | Change | Sales | Sales value |
|---|---|---|---|---|
| 2021 | 1,010 | +8.3% | 61,129 | AED 150.8bn |
| 2022 | 1,210 | +19.8% | 96,518 | AED 263.7bn |
| 2023 | 1,378 | +13.9% | 133,638 | AED 412.3bn |
| 2024 | 1,536 | +11.5% | 181,699 | AED 524.6bn |
| 2025 | 1,671 | +8.8% | 215,608 | AED 686.3bn |
| 2026 (to 10 Nov) | 1,718 | +2.8% | 139,589 | AED 427.4bn |
Source: DXBinteract analysis of Dubai Land Department sale registrations, all property types, ready and off-plan (retrieved 10 Nov 2026). 2026 is a partial year.
For context on what drove these numbers, read our Dubai real estate market report.
What were Dubai's property statistics for January and February 2026?
January and February 2026 were the last two “normal” months before the conflict, and they were exceptionally strong: more deals, higher values and much higher prices per square foot than a year earlier.
Dubai registered 34,407 sales in the first two months of 2026, against 30,261 in January and February 2025, a rise of about 14%. Their value jumped by roughly 39%, from AED 95.8 billion to AED 133.1 billion, and the median price per square foot was 19% to 22% higher than a year earlier.
| Month | Sales | Sales value | Median AED/sq ft | Median price |
|---|---|---|---|---|
| January 2025 | 14,212 | AED 44.6bn | 1,483 | AED 1.66m |
| February 2025 | 16,049 | AED 51.1bn | 1,508 | AED 1.70m |
| January 2026 | 17,295 | AED 71.8bn | 1,816 | AED 1.82m |
| February 2026 | 17,112 | AED 61.3bn | 1,788 | AED 1.70m |
| Jan–Feb 2026 vs 2025 | +13.7% | +38.9% | +22.5% / +18.6% | n/a |
Source: DXBinteract analysis of Dubai Land Department sale registrations, all property types, ready and off-plan (retrieved 10 Nov 2026).
Why these two months matter
They show where the market stood at its peak. When you see a 2026 comparison quoted against “last year”, check which months it uses: a figure that starts in January includes this pre-conflict surge, while one starting in March does not. The early-2026 strength also explains why year-to-date price medians still look positive while monthly figures since May are lower than a year earlier.
How did monthly sales and prices move from October 2025 to October 2026?
Monthly sales roughly halved between late 2025 and the third quarter of 2026, while the median price per square foot slipped from a peak of AED 1,824 in April to AED 1,639 in October.
| Month | Sales | Sales value | Median AED/sq ft |
|---|---|---|---|
| October 2025 | 19,856 | AED 59.2bn | 1,703 |
| November 2025 | 18,997 | AED 64.6bn | 1,758 |
| December 2025 | 18,672 | AED 63.4bn | 1,816 |
| January 2026 | 17,295 | AED 71.8bn | 1,816 |
| February 2026 | 17,112 | AED 61.3bn | 1,788 |
| March 2026 | 13,539 | AED 43.6bn | 1,799 |
| April 2026 | 14,074 | AED 48.5bn | 1,824 |
| May 2026 | 10,298 | AED 29.1bn | 1,655 |
| June 2026 | 14,107 | AED 34.1bn | 1,695 |
| July 2026 | 14,243 | AED 35.4bn | 1,691 |
| August 2026 | 12,081 | AED 28.9bn | 1,689 |
| September 2026 | 11,340 | AED 29.7bn | 1,656 |
| October 2026 | 11,937 | AED 34.0bn | 1,639 |
Source: DXBinteract analysis of Dubai Land Department sale registrations, all property types, ready and off-plan (retrieved 10 Nov 2026). Medians move with the mix of units sold each month.
Reading the monthly pattern
March and April medians stayed high because registrations lag agreements: many of those deals had been signed before the conflict. The real break came in May, when sales fell to 10,298 and the median dropped to AED 1,655. Since June, Dubai has settled into a range of roughly 11,000 to 14,000 sales a month, with the median drifting slowly lower. October 2026 sales were 40% below October 2025 and the median was 3.8% lower.
Valuation data moved faster than registrations. ValuStrat, whose RICS valuers re-mark a fixed basket of homes each month, recorded a cumulative 10% fall in values from 28 February to June. By the end of September its index stood at 218.6 points, 4.5% below a year earlier: the first annual fall in its citywide index since the pandemic.
How do off-plan and ready sales compare in 2026?
Off-plan still makes up about 70% of sales by number, but ready homes have held their prices better and overtook off-plan in value over the first ten months of 2026.
| Year | Off-plan AED/sq ft | Off-plan sales | Ready AED/sq ft | Ready sales |
|---|---|---|---|---|
| 2022 | 1,524 | 49,250 | 1,033 | 47,268 |
| 2023 | 1,584 | 73,577 | 1,144 | 60,061 |
| 2024 | 1,662 | 113,821 | 1,297 | 67,878 |
| 2025 | 1,789 | 146,547 | 1,399 | 69,061 |
| 2026 (to 10 Nov) | 1,782 (−0.4%) | 97,500 | 1,462 (+4.5%) | 42,089 |
Source: DXBinteract analysis of Dubai Land Department sale registrations, all property types, ready and off-plan (retrieved 10 Nov 2026). Off-plan and ready homes differ in location and size, so the gap is not a like-for-like premium.
Primary versus resale in October 2026
In October, developers (primary market) sold 7,609 units worth AED 19.2 billion at a median of AED 1,668 per sq ft, while 4,328 resales were worth AED 14.8 billion at AED 1,554 per sq ft. DLD data reported by Emirates 24|7 shows ready-property sales worth AED 21.0 billion that month against AED 13.1 billion for off-plan, and AED 215.6 billion against AED 196.4 billion over January to October.
ValuStrat counted 24,375 off-plan registrations in Q3 2026, down 45.7% on a year earlier and the fourth quarterly fall in a row, while resales rose 18.5% on the quarter to 9,491. About a third of those resales were under AED 1 million.
What do apartments, villas and townhouses sell for in Dubai?
Apartments make up more than four in five sales. In Q3 2026 their median was AED 1,694 per sq ft, 3% below Q3 2025, for a median ticket of about AED 1.07 million.
| Type (Q3 2026) | Sales | Median AED/sq ft | Median price |
|---|---|---|---|
| Apartments | 31,313 | 1,694 | AED 1.07m |
| Villas | 2,405 | 1,574 | AED 4.95m |
| Townhouses | 1,756 | 1,487 | AED 3.05m |
| Commercial units | 1,485 | 2,234 | AED 2.14m |
| Plots | 676 | 558 | AED 5.69m |
| All sales | 37,664 | 1,683 | n/a |
Source: DXBinteract quarterly report based on Dubai Land Department records, Q3 2026 (retrieved 10 Nov 2026).
Apartment, villa and commercial sales together fell to 35,203 in Q3 2026 from 55,868 in Q3 2025, a 37% drop. In October, 8,942 apartments sold at a median of AED 1,669 per sq ft and AED 1.15 million, and 1,362 villas at a median of AED 4.07 million.
Luxury statistics
Knight Frank counted a record 296 sales above US$10 million in H1 2026, then 86 in Q3, for 412 over nine months, still 15% more than in 2025. The most expensive registered sales of Q3 2026 were an apartment at Aman Residences in Jumeirah Second for AED 166.1 million and a Palm Jumeirah villa for AED 260 million. Prices across Knight Frank’s ten prime neighbourhoods fell 5% between Q2 and Q3.
For building-by-building figures, use our guide to apartment prices in Dubai by area.
Which Dubai areas recorded the most sales and the biggest price changes?
Dubai South led on volume in Q3 2026, while waterfront districts posted the largest price gains and older high-rise areas the largest falls.
| Area (Q3 2026) | Sales | Note |
|---|---|---|
| Dubai South | 5,105 | Also top by value: AED 5.71bn |
| Al Barsha South Fourth | 2,498 | DLD zone that includes Jumeirah Village Circle |
| Wadi Al Safa 4 | 1,932 | Official DLD zone, mostly off-plan |
| Jabal Ali First | 1,509 | Jebel Ali area |
| Wadi Al Safa 3 | 1,436 | Official DLD zone, mostly off-plan |
| Business Bay | n/a | Second by value: AED 4.50bn |
Source: DXBinteract quarterly report based on DLD records, Q3 2026. Area names are official DLD zones.
| Area (apartments) | Jan–Oct 2025 | Jan–Oct 2026 | Change |
|---|---|---|---|
| Dubai Islands | 2,380 | 2,840 | +19.3% |
| Palm Jumeirah | 2,980 | 3,360 | +12.8% |
| Dubai Creek Harbour | 2,420 | 2,560 | +5.8% |
| Dubai South | 1,660 | 1,670 | +0.6% |
| Jumeirah Village Circle | 1,460 | 1,450 | −0.7% |
| Downtown Dubai | 2,910 | 2,820 | −3.1% |
| Business Bay | 2,470 | 2,370 | −4.0% |
| Dubai Marina | 2,360 | 1,970 | −16.5% |
| Jumeirah Lake Towers | 1,950 | 1,570 | −19.5% |
Source: DXBinteract analysis of DLD records, median sale price per sq ft in AED, ready and off-plan apartments combined (retrieved 10 Nov 2026).
ValuStrat’s valuations confirm the split: over the 12 months to June, DIFC (+8.1%) and Dubai Sports City (+6.6%) apartments rose, while Jumeirah Beach Residence (−13%) fell. For villas, Jumeirah Islands (+17.9%) and Emirates Hills (+10.7%) led, while Mudon (−5%) and Dubai Hills Estate (−2.8%) softened. The busiest single community remains Jumeirah Village Circle.
What are the latest rent statistics in Dubai?
New leases are now cheaper than a year ago, while renewals are still rising: a sign that the rental market has turned, but slowly.
| Contract type | Q3 2026 median rent | Change YoY | October 2026 median | Change YoY |
|---|---|---|---|---|
| New apartment lease | AED 68,400 | −2.3% | AED 67,442 | −6.3% |
| Apartment renewal | AED 60,000 | +3.5% | AED 60,000 | +4.9% |
| New villa lease | AED 200,000 | −11.1% | AED 214,618 | −4.6% |
| Villa renewal | AED 194,145 | +10.3% | AED 200,000 | +14.4% |
Source: DXBinteract reports based on DLD Ejari rental registrations, Q3 and October 2026 (retrieved 10 Nov 2026).
Over the whole of 2026 to date, the median annual rent across all contracts is AED 56,999, 3.6% above 2025, and rent per sq ft is flat at about AED 77. The number of registered contracts reached 885,574, against 998,398 for the whole of 2025. Leasing demand remains broad: new apartment leases rose 18.4% in Q3, and Dubai’s population reached 4,807,185 on 29 September.
ValuStrat’s rental index was flat over Q2 2026 (+1.7% on the year), and betterhomes measured apartment rents 3.8% lower between June and September. For yields by district, see the top rental yield areas in Dubai.
How much new housing supply is coming to Dubai?
Launches nearly doubled in 2024 and 2025, and the resulting wave of completions is due mainly in 2027 and 2028.
| Year | Units launched | Units delivered | Units planned (stated handover) |
|---|---|---|---|
| 2023 | 91,858 | 40,268 | – |
| 2024 | 169,266 | 31,566 | – |
| 2025 | 172,955 | 46,186 | – |
| 2026 (to date) | 78,294 | 43,057 | – |
| 2027 | – | – | 122,604 |
| 2028 | – | – | 116,541 |
Source: DXBinteract supply pipeline based on the DLD project registry (retrieved 10 Nov 2026). Handover dates are developers’ stated dates and can slip.
Completions usually run behind schedule. ValuStrat counted about 33,000 homes completed by the end of September, under a third of the full-year projection. About 314,000 units under construction were still below 20% progress, so many of the 2027 and 2028 dates are likely to move.
How should investors use these Dubai market statistics?
Use citywide statistics for direction and timing, but price any purchase on registered deals in the same building.
The same month can produce different headlines depending on the source: DLD totals include mortgages, medians shift with the mix of units sold, and valuation indices react faster than registrations. The share-price index of listed developers is different again, as explained in our Dubai real estate index guide.
- Separate sales from total transactions. Mortgages and gifts inflate DLD totals.
- Compare the same months. January–February 2026 was pre-conflict; comparisons from March onwards tell a different story.
- Split off-plan and ready. Their medians and their trends diverged in 2026.
- Watch new-lease rents. They turn first; renewals follow with a lag.
- Check the handover calendar. Dubai South and the Wadi Al Safa zones carry the largest 2027 deliveries.
Watch out
Monthly medians mix very different properties and can move several percent on the type of homes sold. The 2026 yearly figures are partial and include a very strong pre-conflict start. Treat these statistics as descriptive, not as forecasts, and confirm any price with recent registered sales for the exact unit type.
Frequently asked questions
How many property transactions did Dubai record in 2026?
From January to October 2026, the Dubai Land Department registered 181,866 transactions worth AED 624.8 billion, including sales, mortgages and gifts. Sales alone were worth AED 412.0 billion. The full 2025 total was AED 917 billion.
What is the average price per sq ft in Dubai in 2026?
The median price of all registered sales was AED 1,639 per sq ft in October 2026, 3.8% lower than in October 2025. Over 2026 to date the median is AED 1,718, because January to April were still very strong.
What were Dubai's property sales in January and February 2026?
Dubai registered 17,295 sales worth AED 71.8 billion in January 2026 and 17,112 worth AED 61.3 billion in February. Together that is about 14% more sales and 39% more value than in January and February 2025.
Are off-plan sales still dominant in Dubai?
Yes by number: off-plan made up about 70% of sales in 2026. But ready homes held their prices better (+4.5% per sq ft against −0.4%) and ready sales were worth more than off-plan from January to October: AED 215.6 billion against AED 196.4 billion.
Are Dubai rents falling in 2026?
New leases are. The median new apartment lease was AED 67,442 in October 2026, 6.3% lower than a year earlier, while renewals were 4.9% higher at AED 60,000. New villa leases fell 4.6% to AED 214,618.
Figures are indicative as of the date shown: check them with official sources before any decision.
- For information only; this is not tax, legal or financial advice.
Want these statistics for one building?
Read next
Dubai
price per sq ft trends by segment and area, with the 2027 outlook.

Dubai
why developer share indices fell faster than actual home prices.
Dubai
how Dubai’s booms and corrections have played out since 2008.