
Abu Dhabi price per square metre by area 2026 (data study)
- Published 26 Oct 2026
- Updated 26 October 2026
- 11 min read
- Data verified on 26 Oct 2026
In short
In 2026, a ready home in Abu Dhabi sells for an average of AED 1,442 per sq ft, or about AED 15,520 per square metre, according to ValuStrat (Q2 2026). Prices vary 3.7-fold by area: about AED 1,040–1,065/sq ft in Al Ghadeer and Al Reef, against AED 3,893/sq ft for an apartment on Saadiyat Island.
ValuStrat, Q2 2026 · Knight Frank, year to June 2026 · Bayut, H1 2026 report
+17.8% year on year
Residential values; apartments +24.1%, villas +12%
Source: ValuStrat, Q2 2026
AED 43,100/m²
Average apartment transaction price on Saadiyat Island, the most expensive market
Source: Knight Frank, year to June 2026
8.92%
Highest gross rental yield in the study: Al Reef apartments
Source: Bayut, H1 2026 report
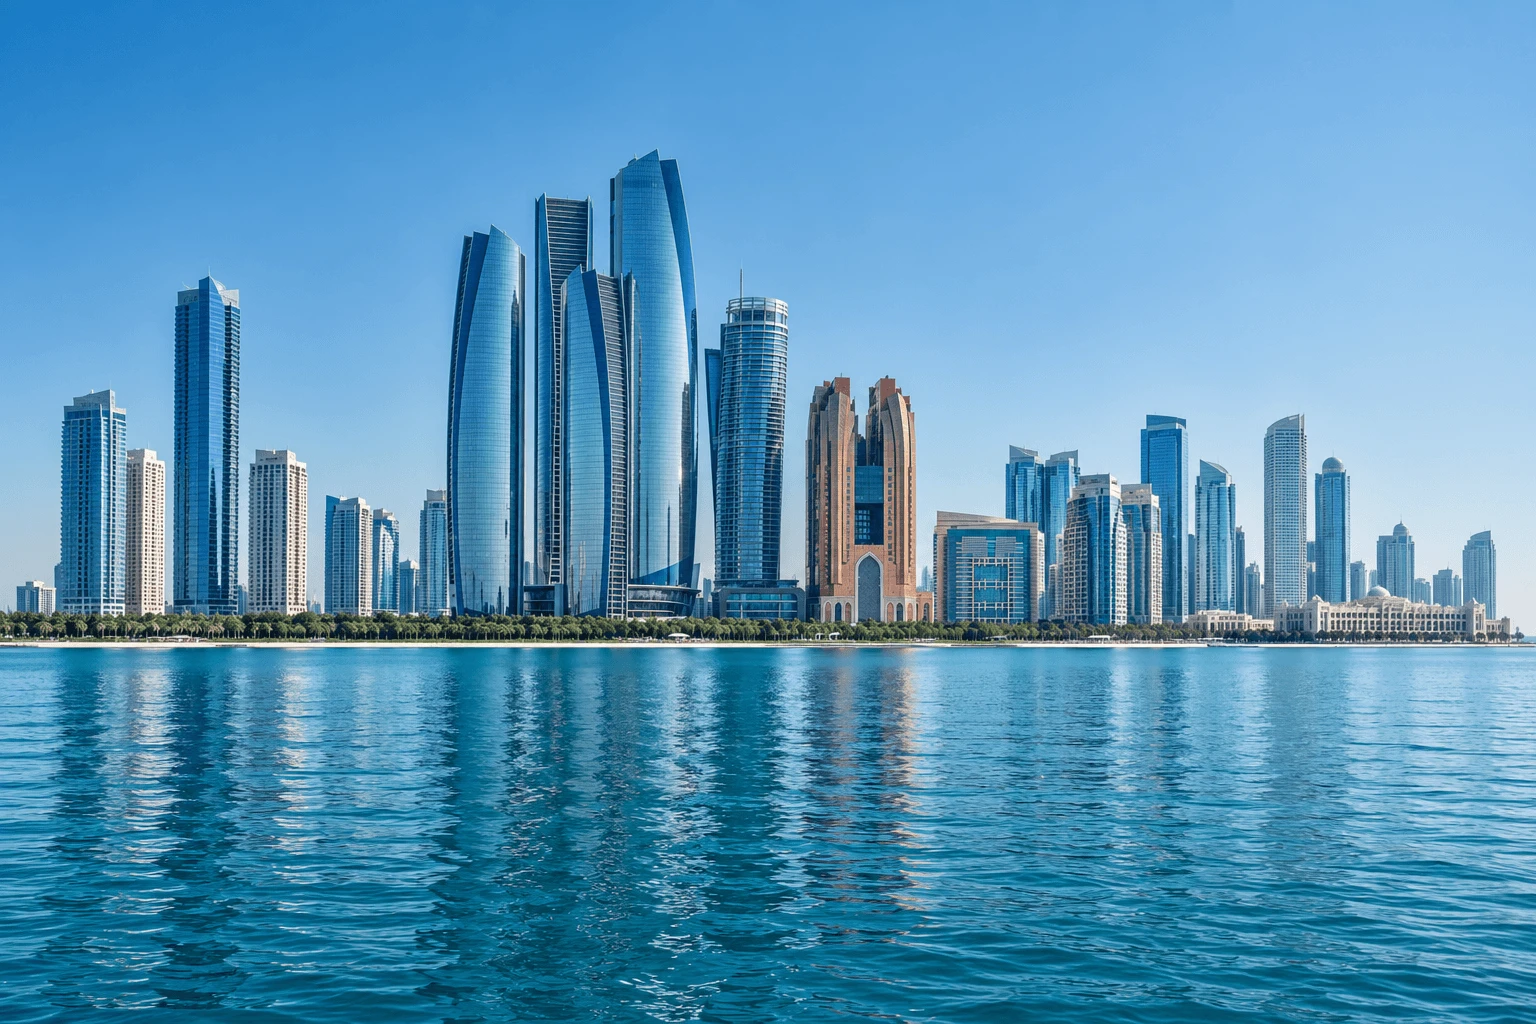
The Abu Dhabi skyline.Photo: © VALORISIMO
In this article · 9 sections
- What does a square metre cost in Abu Dhabi in 2026?
- What is the apartment price per sq ft in each area?
- What is the villa price per sq ft in each area?
- Which are the cheapest and most expensive areas?
- Where have prices risen most in a year?
- Price per sq ft or rental yield: what is the trade-off?
- Is Abu Dhabi cheaper than Dubai per sq ft?
- Methodology: sources, period, conversion and limits
- Frequently asked questions
What does a square metre cost in Abu Dhabi in 2026?
The average sale price of a ready home in Abu Dhabi in Q2 2026 was AED 1,442 per sq ft, or AED 15,520 per m², according to the ValuStrat index reported by Khaleej Times on 4 August 2026. That is 10.9% higher than a year earlier.
Off-plan costs considerably more: AED 2,104 per sq ft on average in Q2 2026 (AED 22,650/m²), up 21.2% year on year (ValuStrat). New off-plan stock therefore carries a premium of roughly 46% over ready homes, reflecting newer island and waterfront locations as well as the cost of staged payment plans.
ValuStrat’s residential value index rose 17.8% year on year (151.1 points), led by apartments (+24.1%) rather than villas (+12%). Momentum is easing: +2.1% quarter on quarter, the slowest quarterly gain in two years according to the same source.
Volumes confirm the strength of the market. The Abu Dhabi Real Estate Centre (ADREC) recorded AED 117 billion of real estate transactions in H1 2026 (+112%), including AED 86.1 billion of sales across 16,838 transactions (release of 17 July 2026). Over the first eight months, the total reached AED 155 billion, already above the AED 142 billion recorded for all of 2025 (Khaleej Times, 3 September 2026, citing ADREC).
| Indicator (Abu Dhabi, 2026) | AED/sq ft | AED/m² | Year-on-year change |
|---|---|---|---|
| Ready homes, average sale price | 1,442 | 15,520 | +10.9% |
| Off-plan homes, average sale price | 2,104 | 22,650 | +21.2% |
| ValuStrat index, all homes | — | — | +17.8% |
| ValuStrat index, apartments | — | — | +24.1% |
| ValuStrat index, villas | — | — | +12% |
Source: ValuStrat Q2 2026 report, as reported by Khaleej Times (4 August 2026). Conversion by Valorisimo: 1 sq ft = 0.0929 m².
What is the apartment price per sq ft in each area?
This table is the core of the study. It combines two families of sources: asking prices from listings (Bayut, H1 2026 report) and transaction prices published by Knight Frank and ValuStrat. The “asking-price change” column is a Valorisimo calculation: H1 2026 average asking price versus H1 2025, same source and same Bayut method.
| Area | AED/sq ft (asking, H1 2026) | AED/m² | Asking-price change H1 2026 vs H1 2025 | Transaction-price change, 1 year | Gross yield |
|---|---|---|---|---|---|
| Saadiyat Island | 3,893 | 41,900 | +37.4% | +21% (KF); +18.3% (VS) | 3.51% |
| Al Maryah Island | 2,707 | 29,140 | n/a | n/a | 5.94% |
| Yas Island | 2,393 | 25,760 | +37.8% | +18% (KF) | 5.94% |
| Al Raha Beach | 1,859 | 20,010 | +33.0% | n/a | 5.72% |
| Masdar City | 1,781 | 19,170 | +44.2% | n/a | 7.63% |
| Al Reem Island | 1,690 | 18,190 | +32.2% | +18% (KF); +22% (VS) | 6.34% |
| Al Reef | 1,065 | 11,460 | +39.0% | +41.6% (VS) | 8.92% |
| Al Ghadeer | 1,039 | 11,180 | +12.6% | n/a | 8.44% |
Source: Bayut, Abu Dhabi Sales Market Report H1 2026 and H1 2025 (asking prices of ready properties; gross “projected ROI”); Knight Frank (KF), Abu Dhabi Residential and Office Market Review, 22 July 2026, changes to end-June 2026; ValuStrat (VS), Q2 2026, via Khaleej Times, 4 August 2026. Conversions and asking-price changes: Valorisimo calculation. n/a = not available from a verified source.
The Saadiyat cross-check. Both source families agree on the top of the market: Bayut shows AED 3,893/sq ft asking (about AED 41,900/m²), while Knight Frank measures AED 43,100/m² in transactions. The gap is under 3%, which gives good confidence in the area’s price level.
The Marina district. Bayut also publishes an asking price of AED 2,831/sq ft (about AED 30,470/m²) and a 5.40% gross yield for “The Marina”, near the Corniche. We do not treat it as Corniche/Al Khalidiya, for which no reliable average is published (see section 4).
At a glance, four price bands emerge: Saadiyat alone above AED 40,000/m²; Al Maryah and Yas between AED 25,000 and 30,000/m²; Al Raha Beach, Masdar City and Al Reem around AED 18,000–20,000/m²; Al Reef and Al Ghadeer around AED 11,000–11,500/m². For ranges by unit type, see our Abu Dhabi apartment prices page.
What is the villa price per sq ft in each area?
Villas cost less per square foot than apartments in every area where both exist, because larger plots and built-up areas dilute the unit price. They have also risen more slowly: +12% year on year on the ValuStrat index, against +24.1% for apartments.
| Area | AED/sq ft (asking, H1 2026) | AED/m² | Asking-price change H1 2026 vs H1 2025 | Transaction-price change, 1 year | Gross yield |
|---|---|---|---|---|---|
| Saadiyat Island | 2,250 | 24,220 | +10.1% | +12% (VS) | 4.32% |
| Yas Island | 1,634 | 17,590 | +7.9% | n/a | 5.00% |
| Al Raha Beach | 1,418 | 15,260 | +21.1% | +4.6% (VS, “Al Raha”) | 5.11% |
| Al Reef | 1,070 | 11,520 | +28.0% | +27.9% (VS) | 5.92% |
| Al Raha Gardens | 984 | 10,590 | +10.1% | n/a | 5.91% |
| Al Jubail Island | Not published (insufficient data) | — | n/a | about +40% (KF) | n/a |
| Al Reem Island (villas) | n/a | — | n/a | −22% (KF) | n/a |
Source: Bayut, Abu Dhabi Sales Market Report H1 2026 and H1 2025 (asking prices, ready properties); Knight Frank (KF), 22 July 2026, changes to end-June 2026; ValuStrat (VS), Q2 2026, via Khaleej Times, 4 August 2026. Conversions and asking-price changes: Valorisimo calculation.
On transaction prices, Knight Frank puts the emirate’s most expensive villa market on Saadiyat at AED 26,500/m² on average (about AED 2,462/sq ft), consistent with the AED 24,220/m² asked on Bayut.
Which are the cheapest and most expensive areas?
Apartment ranking by price per square metre (Bayut asking prices, H1 2026)
| Rank | Area | AED/sq ft | AED/m² | Index (Al Ghadeer = 100) |
|---|---|---|---|---|
| 1 | Saadiyat Island | 3,893 | 41,900 | 375 |
| 2 | Al Maryah Island | 2,707 | 29,140 | 261 |
| 3 | Yas Island | 2,393 | 25,760 | 230 |
| 4 | Al Raha Beach | 1,859 | 20,010 | 179 |
| 5 | Masdar City | 1,781 | 19,170 | 171 |
| 6 | Al Reem Island | 1,690 | 18,190 | 163 |
| 7 | Al Reef | 1,065 | 11,460 | 103 |
| 8 | Al Ghadeer | 1,039 | 11,180 | 100 |
Source: Bayut, Abu Dhabi Sales Market Report H1 2026 (asking prices). Conversion and index: Valorisimo calculation.
Three quotable findings:
- Abu Dhabi's most expensive square foot costs 3.7 times its cheapest. A Saadiyat Island apartment (AED 3,893/sq ft) is priced 3.7 times higher per sq ft than Al Ghadeer (AED 1,039/sq ft).
- Al Reem Island, one of the busiest markets, sits at the low end of the urban segment. At AED 1,690/sq ft it is 9% cheaper than Al Raha Beach and 29% cheaper than Yas Island, despite AED 9.45 billion of transactions in Q1 2026 (ADREC).
- Al Maryah Island, the financial district, costs more than Yas. At AED 2,707/sq ft it is the second most expensive apartment market in the ranking.
Areas with no reliable published average. For several areas investors ask about, we found no average price per sq ft from a verifiable source. We say so rather than publish an estimate.
| Area | What is verified in 2026 | Average price per m² |
|---|---|---|
| Hudayriyat Island | AED 11.97 billion of transactions in Q1 2026, the highest of the areas cited by ADREC | Not published (insufficient data) |
| Al Jubail Island | Villas about +40% year to June 2026, the strongest rise in the emirate (Knight Frank) | Not published (insufficient data) |
| Ramhan Island | Eagle Hills off-plan project, launch prices set phase by phase | Not published (insufficient data) |
| Corniche / Al Khalidiya | Too few sale listings for an average (2 listings on Property Finder when checked) | Not published (insufficient data) |
Source: ADREC via Gulf News (7 April 2026); Knight Frank (22 July 2026); Property Finder, Al Khalidiya page (checked 26 October 2026).
Prices in these areas are read project by project, from developer price lists and DARI records. Our comparison of off-plan vs ready property in Abu Dhabi explains how to assess them.
Where have prices risen most in a year?
We compare two readings: the change in asking prices (Bayut, H1 2026 vs H1 2025) and the change in transaction prices (Knight Frank, ValuStrat).
| Area (apartments unless stated) | Asking-price rise | Transaction-price rise | Gap |
|---|---|---|---|
| Masdar City | +44.2% | n/a | — |
| Al Reef | +39.0% | +41.6% (VS) | aligned |
| Yas Island | +37.8% | +18% (KF) | asking +20 pts |
| Saadiyat Island | +37.4% | +21% (KF); +18.3% (VS) | asking +16 to +19 pts |
| Al Raha Beach | +33.0% | n/a | — |
| Al Reem Island | +32.2% | +18% (KF); +22% (VS) | asking +10 to +14 pts |
| Al Ghadeer | +12.6% | n/a | — |
| Al Jubail Island (villas) | n/a | about +40% (KF) | — |
| Al Reem Island (villas) | n/a | −22% (KF) | — |
Source: Bayut, H1 2025 and H1 2026 reports (Valorisimo calculation); Knight Frank (KF), 22 July 2026; ValuStrat (VS), Q2 2026, via Khaleej Times (4 August 2026).
The biggest verified risers on transaction prices are Al Reef apartments (+41.6%) and Al Jubail Island villas (about +40%), followed by Al Reef villas (+27.9%), Al Reem apartments (+18% to +22%) and Saadiyat apartments (+18% to +21%).
The most useful finding for buyers: on Yas, Saadiyat and Al Reem, asking prices rose 10 to 20 points faster than prices actually paid. Rule of thumb: negotiate from registered transactions, not from listings. Only Al Reef shows asking prices moving in line with transactions.
Any falls? The only significant fall recorded is Al Reem Island villas (−22%), while apartments in the same area rose. Our guide on where Abu Dhabi values are rising explains what these divergences mean for choosing a property.
Price per sq ft or rental yield: what is the trade-off?
The data show a clear pattern: the higher the price per sq ft, the lower the gross yield.
| Profile | Areas | Apartment price per sq ft | Gross yield | Reading |
|---|---|---|---|---|
| High yield, low ticket | Al Reef, Al Ghadeer | AED 1,039–1,065 | 8.44–8.92% | income first, outer communities |
| Balanced | Masdar City, Al Reem Island | AED 1,690–1,781 | 6.34–7.63% | mid-range price, urban rental demand |
| Lifestyle / waterfront | Al Raha Beach, Yas Island, Al Maryah | AED 1,859–2,707 | 5.72–5.94% | average yield, deeper market |
| Wealth preservation | Saadiyat Island | AED 3,893 | 3.51% | capital preservation, scarcity |
Source: Bayut, Abu Dhabi Sales Market Report H1 2026 (asking prices and gross “projected ROI”). Grouping: Valorisimo.
Two takeaways:
- Masdar City offers the best price-to-yield ratio in the mid-range7.63% gross at a price per sq ft close to Al Reem’s (6.34%). It also posted the strongest asking-price rise (+44.2%), which, if rents stay flat, will compress yields for new buyers.
- Gross yields fell everywhere between 2025 and 2026On the same Bayut source, Al Reem dropped from 7.59% to 6.34%, Yas from 7.15% to 5.94%, Masdar from 8.41% to 7.63%. Prices are rising faster than rents: ValuStrat measures +4.7% year on year for residential rents, against +17.8% for values.
These are gross yields, before service charges, vacancy, management and purchase costs. See our best areas for rental yield in Abu Dhabi and model a specific unit with our investment comparison tool.
Is Abu Dhabi cheaper than Dubai per sq ft?
Yes, on average, by about 10–12%. Dubai’s average residential sale price was AED 1,636/sq ft in August 2026, down 1.7% year on year, according to Cavendish Maxwell. Against Abu Dhabi’s ready-market average of AED 1,442/sq ft (ValuStrat, Q2 2026), the gap is about −12%, consistent with Knight Frank’s estimate that Abu Dhabi prices are “on average 10% lower than Dubai”.
The direction of travel is the opposite: +17.8% year on year in Abu Dhabi (ValuStrat, Q2 2026) against −1.7% in Dubai (Cavendish Maxwell, August 2026), Dubai’s first annual decline since February 2021 according to the same firm. Periods and methods differ slightly (quarter vs month, two firms), so the comparison gives an order of magnitude, not an exact gap. For the full comparison, read Dubai vs Abu Dhabi: where should you invest.
Methodology: sources, period, conversion and limits
Sources. We used only public sources consulted on 26 October 2026:
- Bayut, Abu Dhabi Sales Market Report H1 2026 (page updated 13 October 2026) and H1 2025: average asking price per sq ft and projected gross yield by area, for ready properties.
- Knight Frank, Abu Dhabi Residential and Office Market Review, published 22 July 2026: transaction prices and one-year changes to end-June 2026.
- ValuStrat, Q2 2026 report (reported by Khaleej Times, 4 August 2026): value index, average ready and off-plan sale prices, community-level changes, rents.
- ADREC (Abu Dhabi Real Estate Centre): transaction values and volumes (H1 2026, Q1 2026, eight months of 2026), via the Abu Dhabi Media Office, Gulf News and Khaleej Times.
- Cavendish Maxwell (via Zawya) for the Dubai anchor, August 2026.
Period. Latest data available: H1 2026 (Bayut), twelve months to end-June 2026 (Knight Frank), Q2 2026 (ValuStrat), August 2026 (Dubai).
Conversion. Prices published in AED/sq ft are converted to AED/m² by dividing by 0.0929 (1 sq ft = 0.0929 m², i.e. × 10.764), rounded to the nearest 10. Prices published in AED/m² (Knight Frank) are shown as published, with a sq ft equivalent where useful.
Asking-price changes. These compare the average asking price for the same area in Bayut’s H1 2026 and H1 2025 reports. They are a Valorisimo calculation, not a figure published by Bayut.
Limits
- Asking ≠ transacted. Bayut columns reflect listings, not registered deals, and generally overstate transaction prices, as the 10–20 point gap in section 5 shows.
- Ready ≠ off-plan. Bayut prices cover completed homes. Off-plan, which accounts for most sales (84% of residential transactions in Q2 2026 according to ValuStrat), sells for about 46% more per sq ft on average.
- Composition effect. An area average also moves when newer, pricier units come to market: a rise does not mean every existing unit gained as much.
- Projected gross yields. Bayut's "projected ROI" relates asking rents to asking prices; it does not deduct service charges, vacancy or costs.
- Incomplete coverage. Hudayriyat, Jubail, Ramhan and Corniche/Al Khalidiya have no verifiable published average; we flag this rather than estimate.
Watch out
Asking prices rose 10 to 20 points faster than transaction prices on Yas, Saadiyat and Al Reem over the year. A listing is not a price benchmark: before making an offer, compare it with registered DARI transactions in the same building. Supply is also rising: about 36,900 homes are under construction for delivery between 2026 and 2030, including about 7,700 on Yas Island (Knight Frank, July 2026).
Frequently asked questions
*What is the average price per square metre in Abu Dhabi in 2026?
In Q2 2026, a ready home in Abu Dhabi sold for an average of AED 1,442 per sq ft, or about AED 15,520 per square metre, according to ValuStrat. Off-plan homes cost more, at AED 2,104 per sq ft on average (about AED 22,650/m²). Prices then vary widely by area and property type, from about AED 1,040/sq ft to almost AED 3,900/sq ft.
*Which is the most expensive area in Abu Dhabi per sq ft?
Saadiyat Island. Knight Frank measures an average apartment transaction price of AED 43,100 per square metre there (up 21% in the year to June 2026) and AED 26,500/m² for villas. Bayut’s H1 2026 listings give a similar level for apartments, at AED 3,893 per sq ft, or about AED 41,900 per square metre.
*Which is the cheapest area in Abu Dhabi for an apartment?
Among the areas studied, Al Ghadeer and Al Reef are the cheapest, at about AED 1,039 and AED 1,065 per sq ft in asking prices in H1 2026 (Bayut), or about AED 11,200–11,500 per square metre. They also have the highest gross rental yields in the study, at 8.44% and 8.92% respectively.
*How much have Abu Dhabi property prices risen in a year?
ValuStrat’s index rose 17.8% year on year in Q2 2026, with apartments up 24.1% and villas up 12%. The strongest verified rises were in Al Reef apartments (+41.6%) and Al Jubail Island villas (about +40% according to Knight Frank). By contrast, Al Reem Island villas fell 22% over the same period.
*Is Abu Dhabi cheaper than Dubai?
On average, yes, by about 10–12%. Dubai’s average sale price was AED 1,636 per sq ft in August 2026 according to Cavendish Maxwell, against AED 1,442 per sq ft for Abu Dhabi’s ready market in Q2 2026 (ValuStrat). Knight Frank puts the average gap at 10%. Prime Abu Dhabi areas such as Saadiyat are still well above the Dubai average.
Figures are indicative as of the date shown: check them with official sources before any decision.
- For information only; this is not tax, legal or financial advice.
Want to check a price per sq ft before you make an offer?
Send us the listing: an analyst will benchmark it against registered transactions and the area’s yield, on WhatsApp at +971 54 236 4178.
Read next

Abu Dhabi
which areas and property types to favour for your strategy, based on Knight Frank data.
Abu Dhabi
where rental income is strongest relative to purchase price.
Abu Dhabi
the most expensive square metre in Abu Dhabi, explained.