


Special payment plan


Special payment plan
10% off
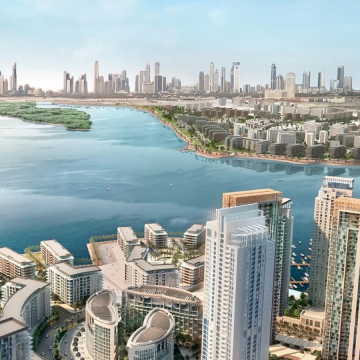
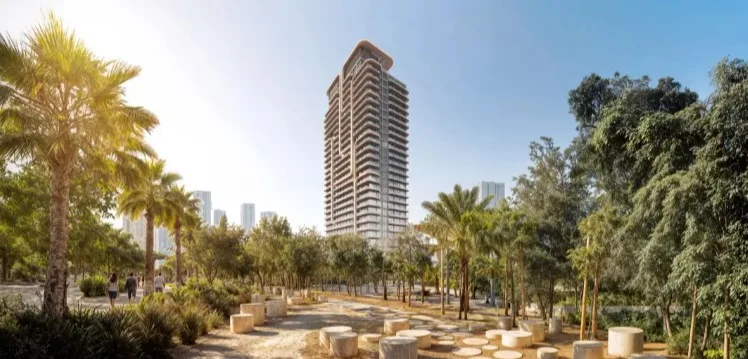
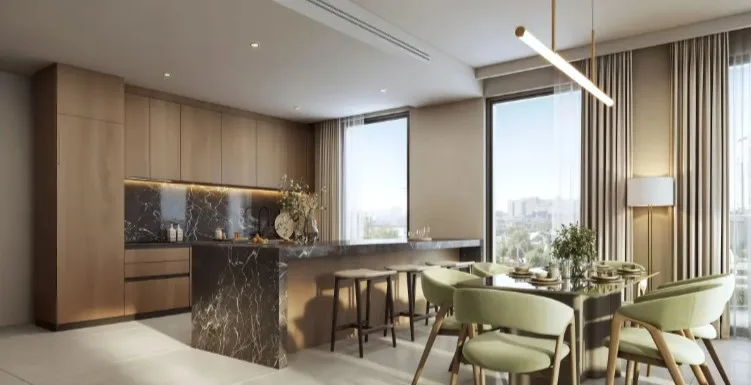
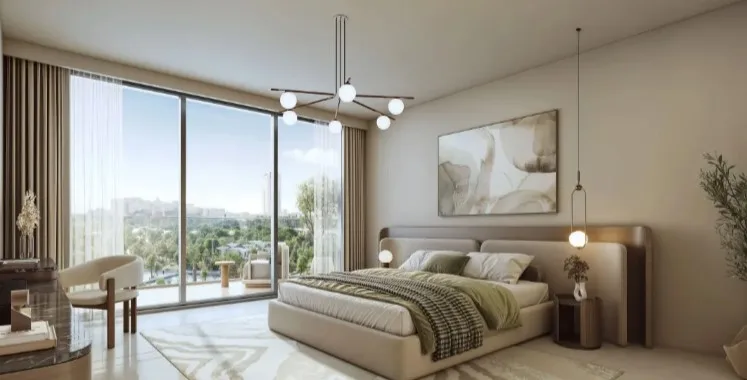
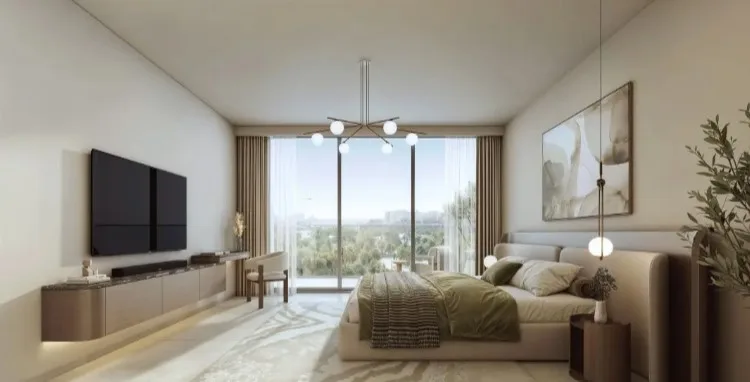
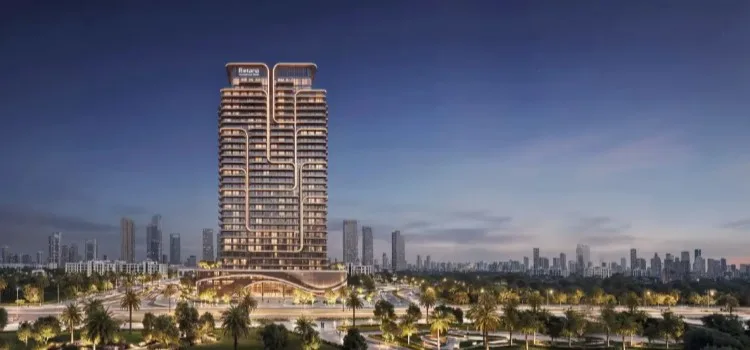
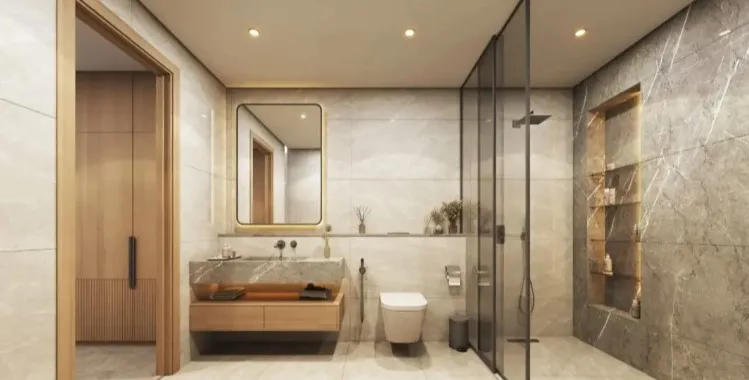
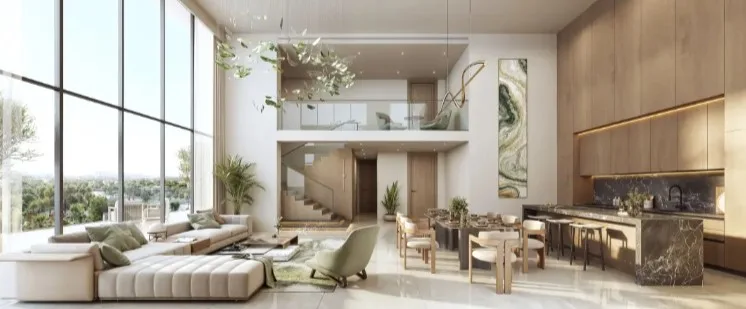
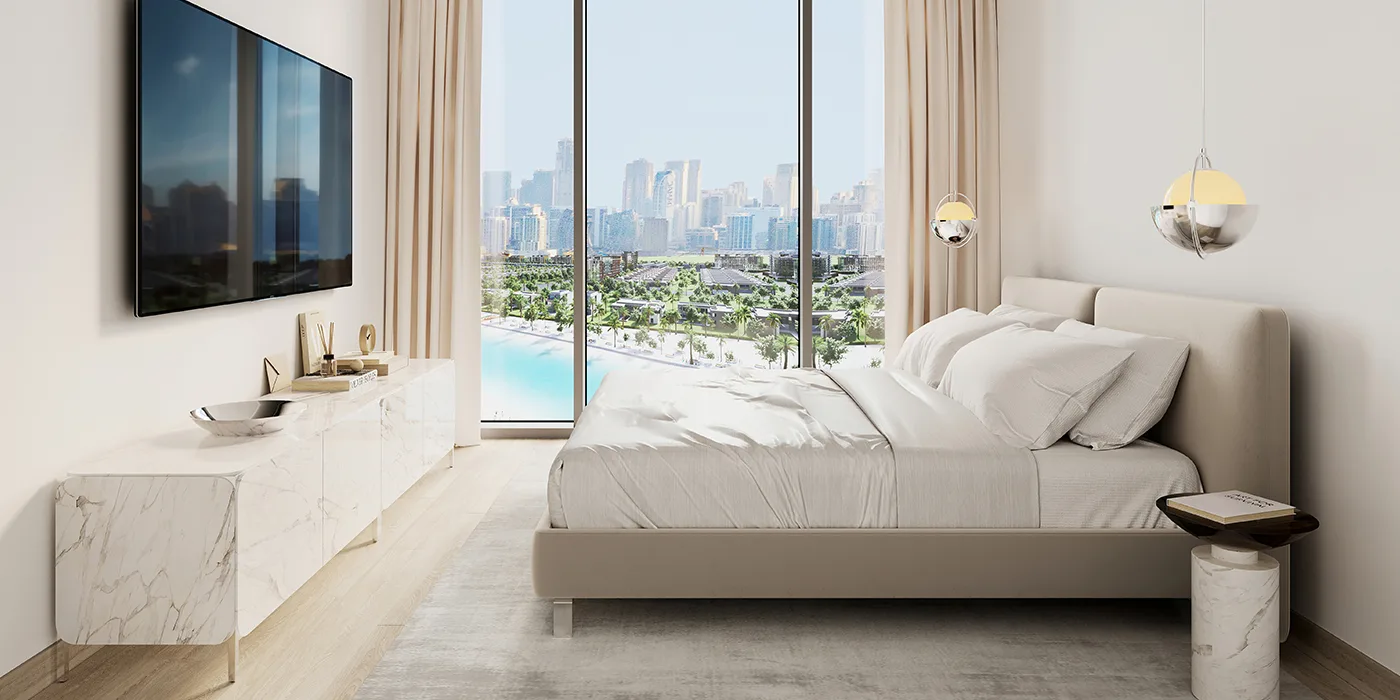
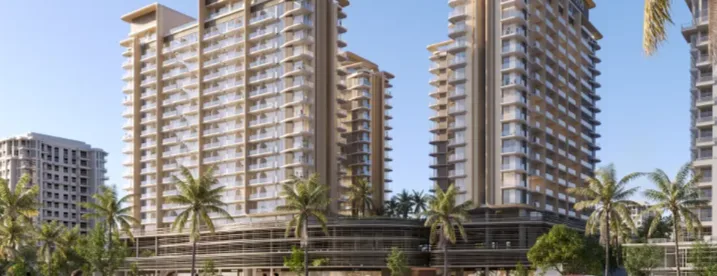
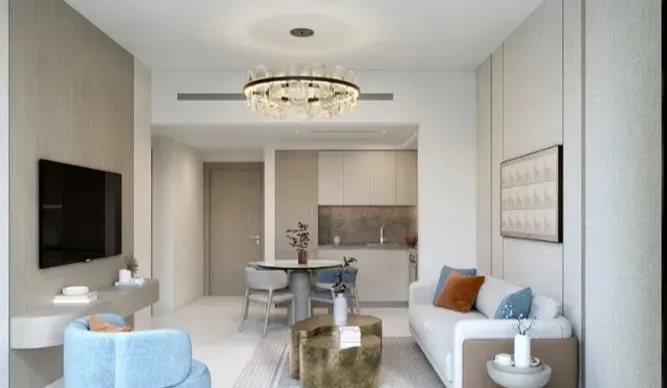
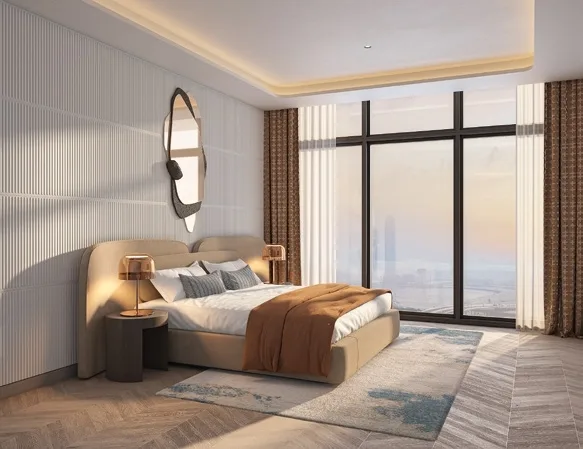
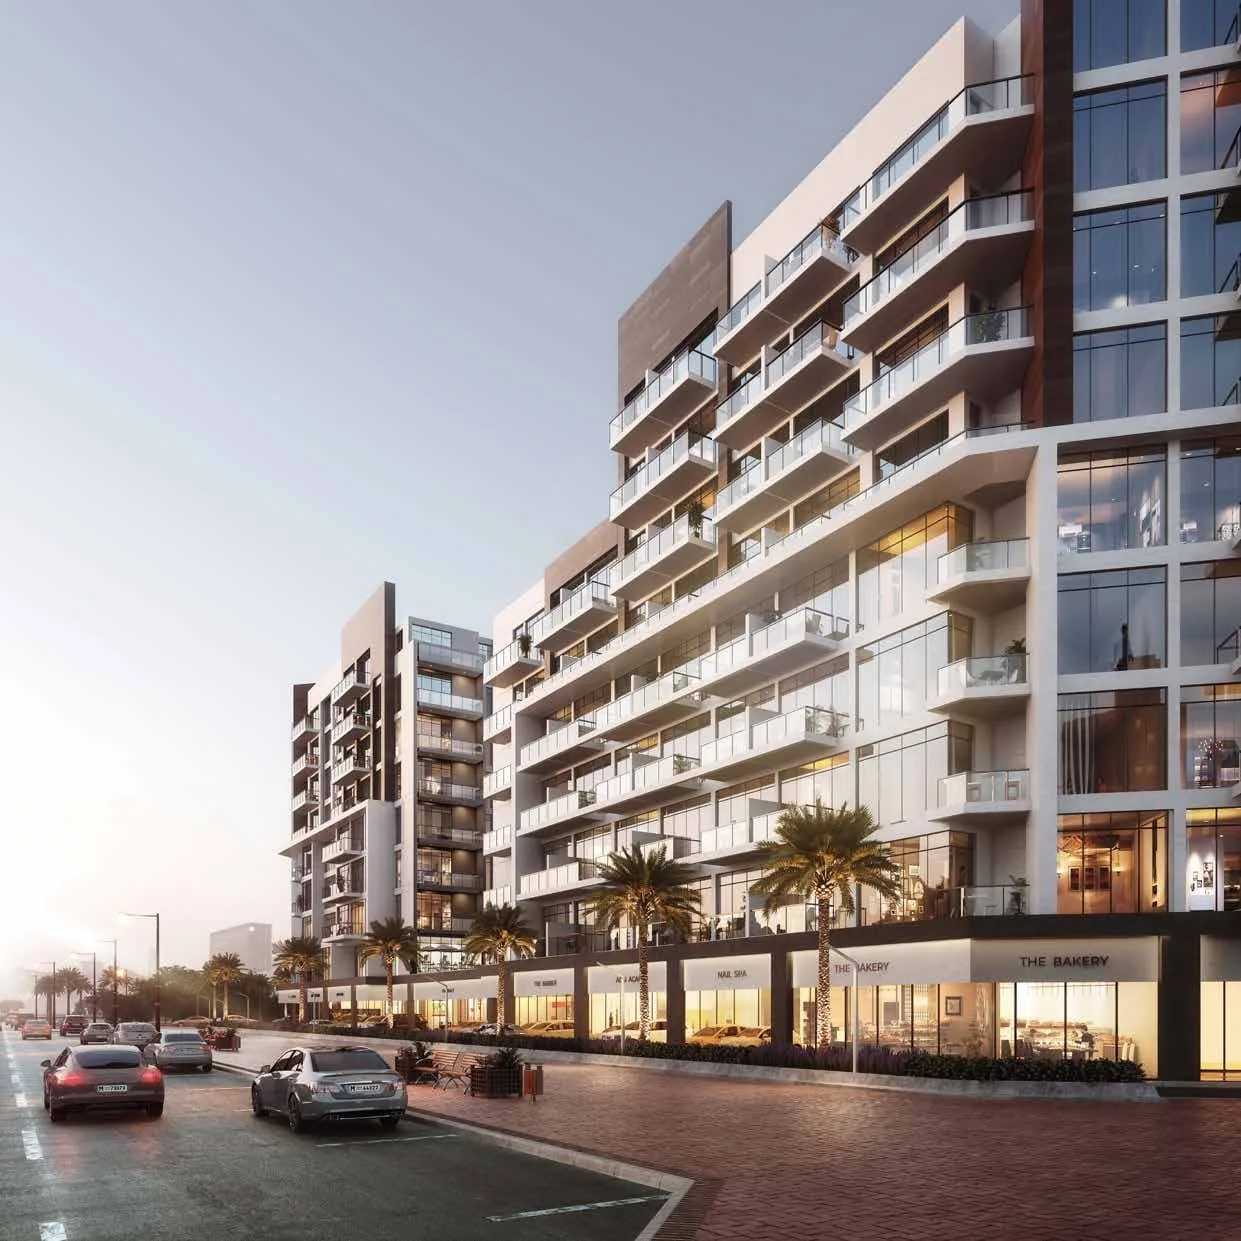
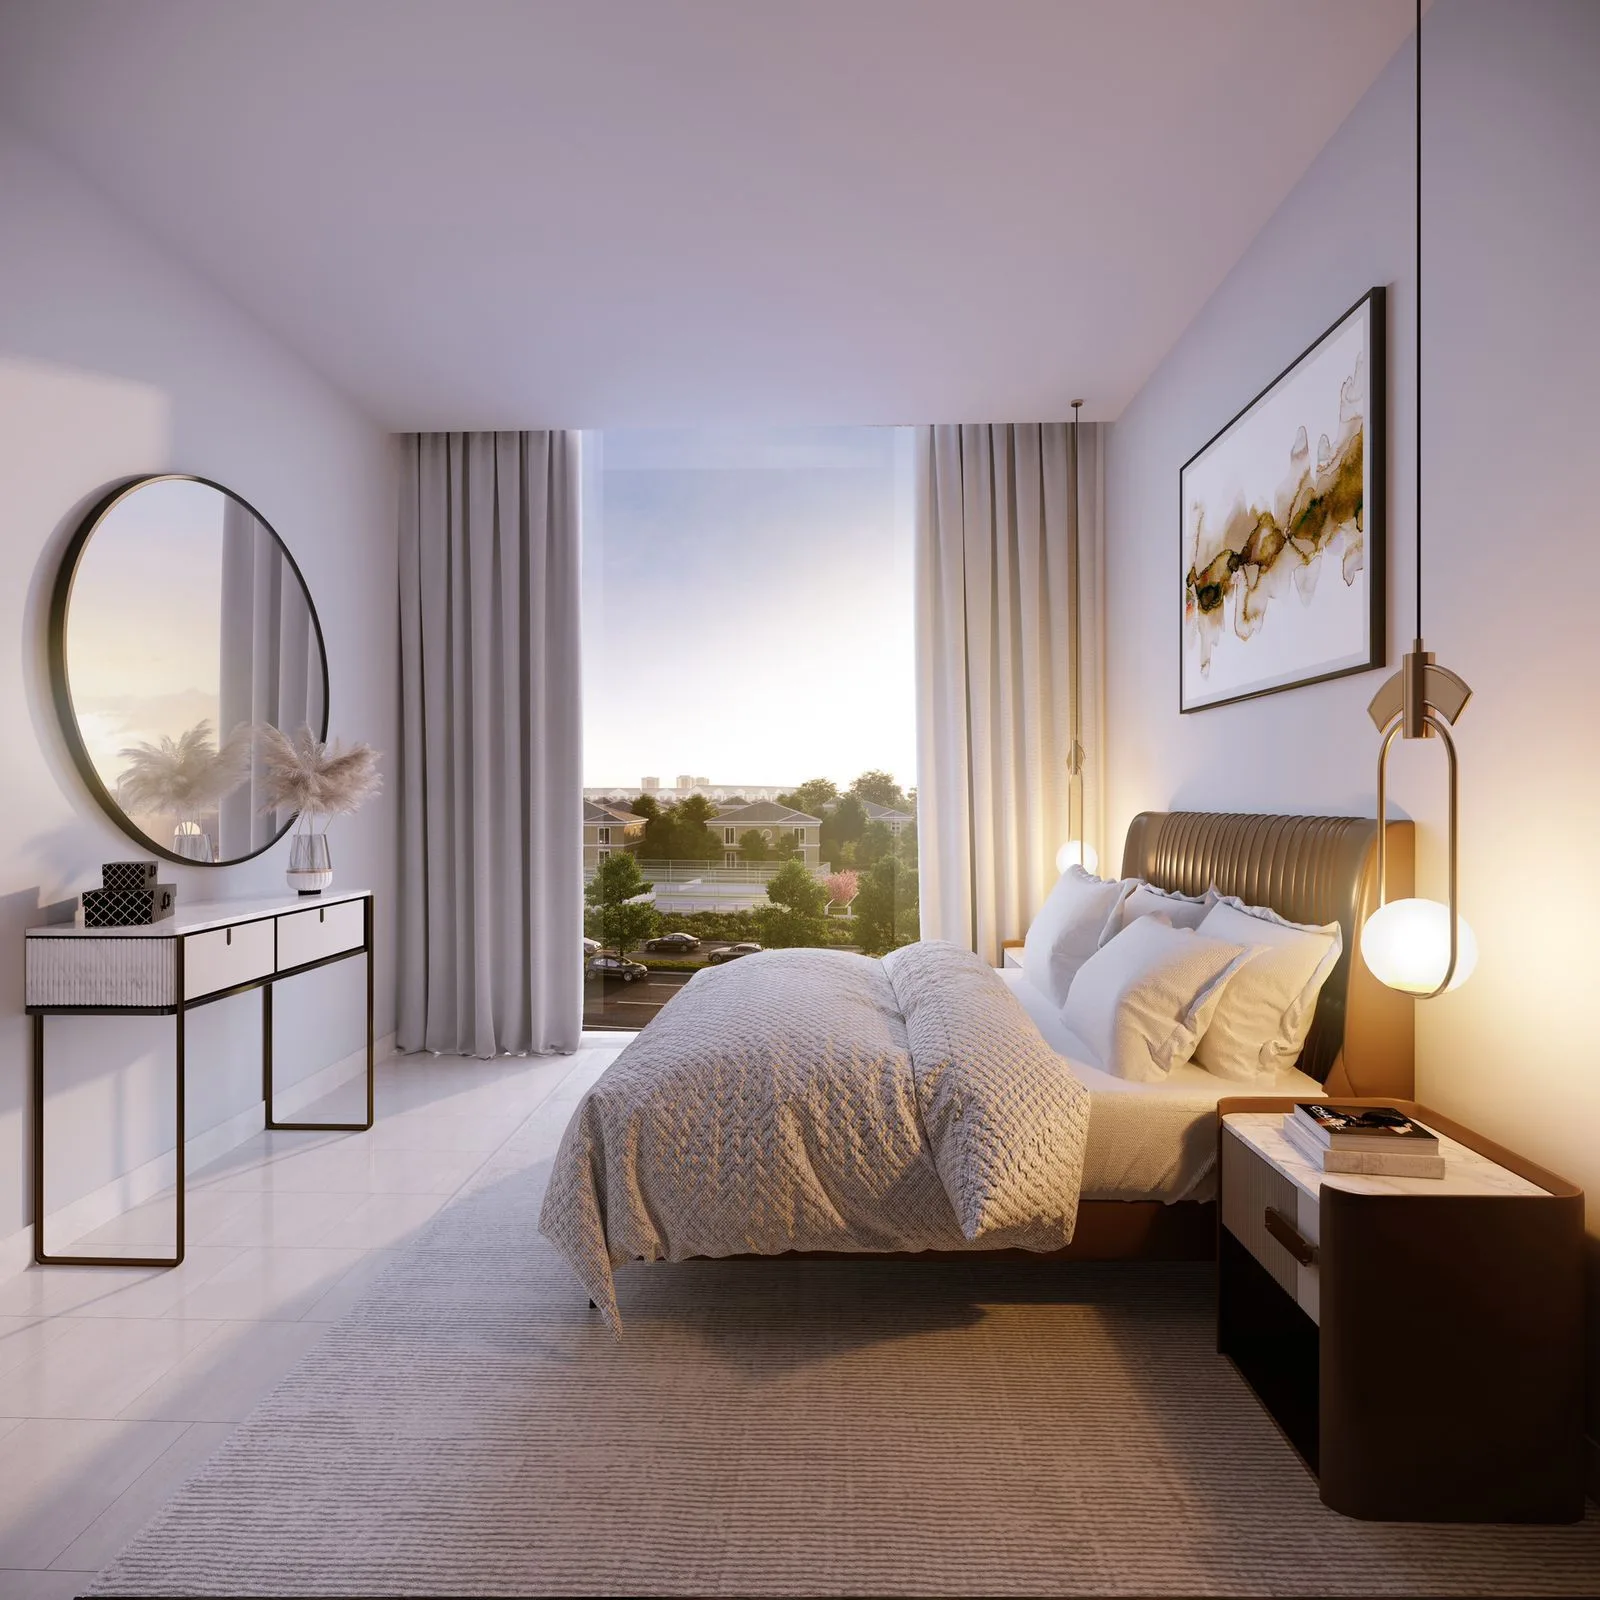
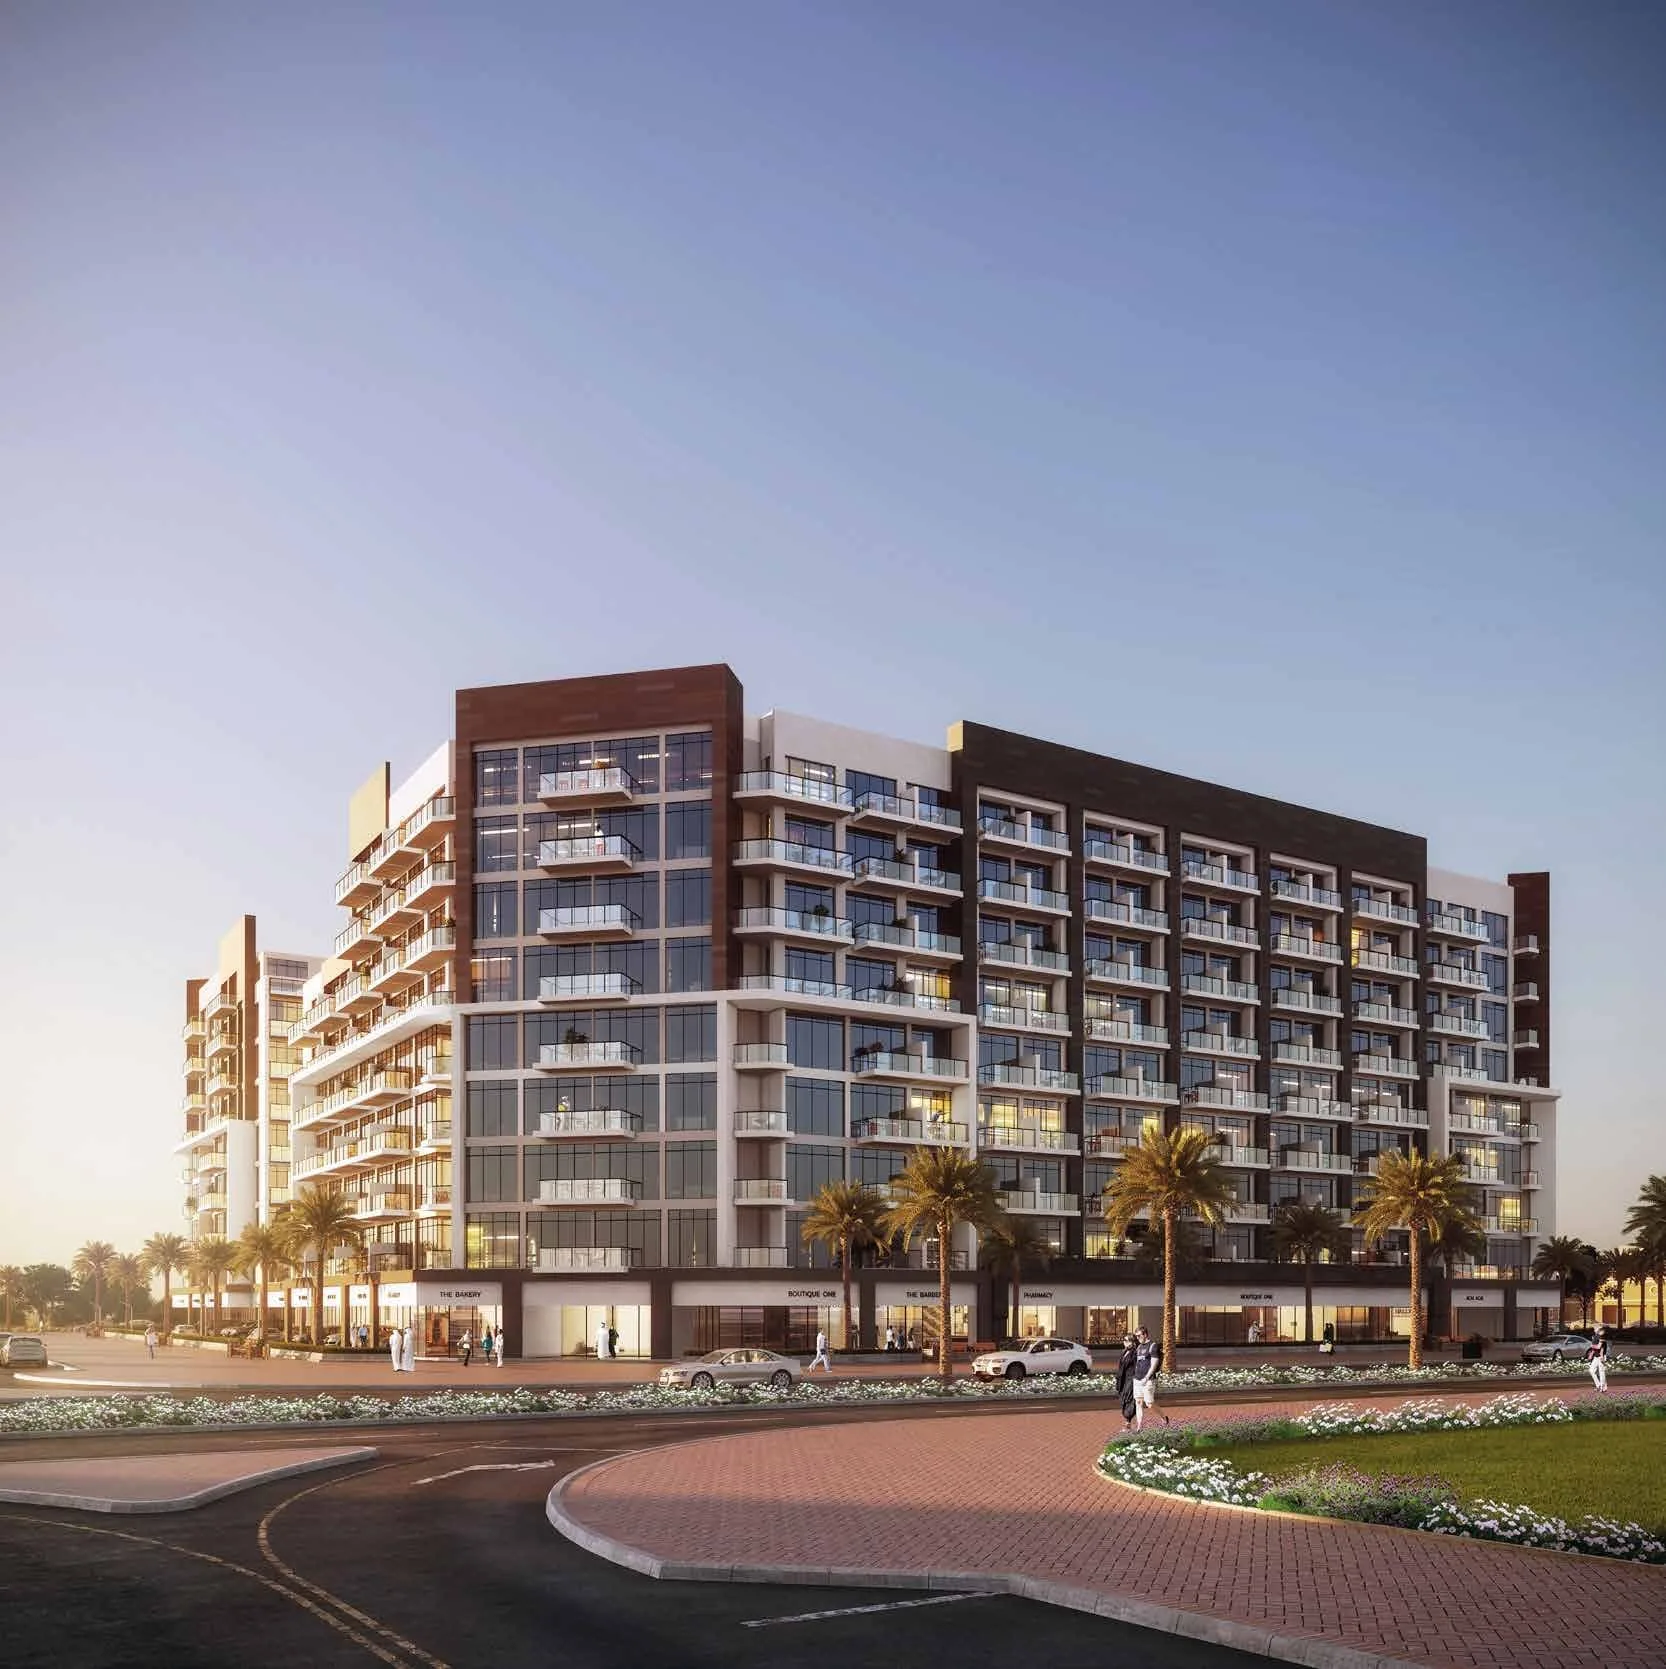
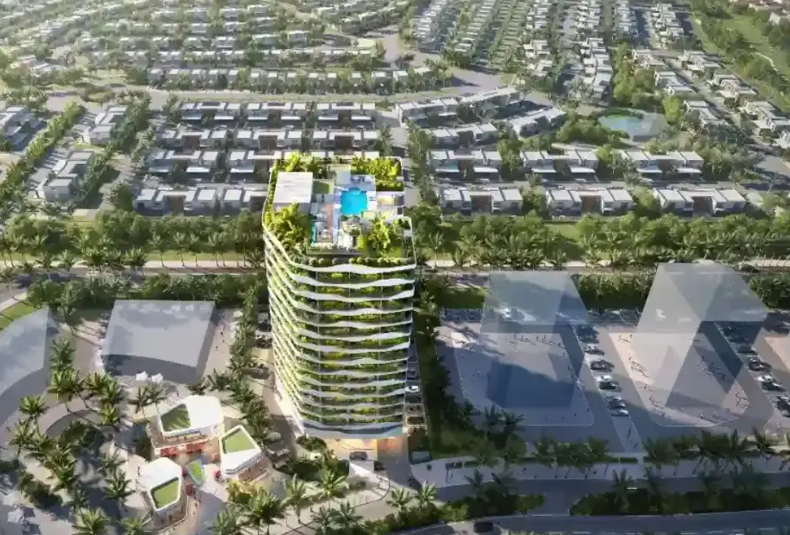
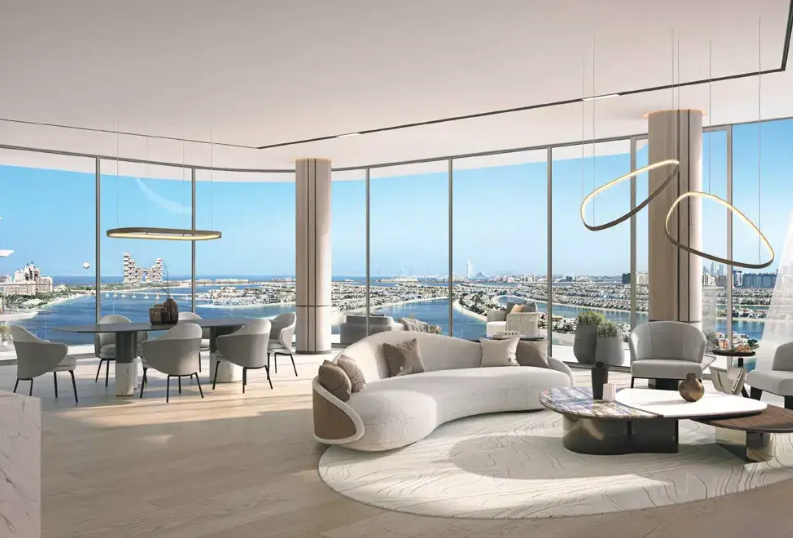
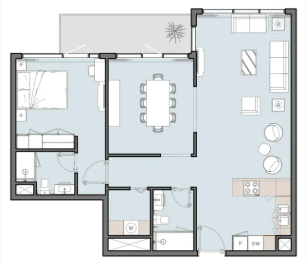
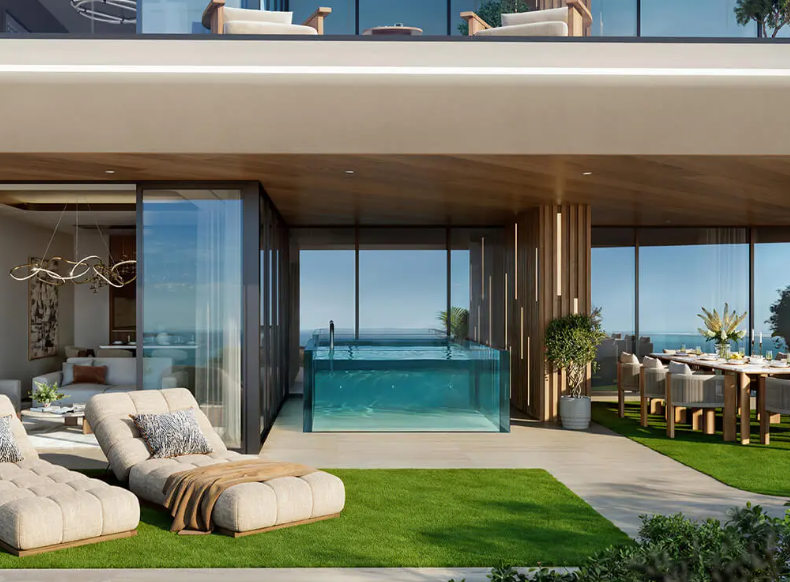
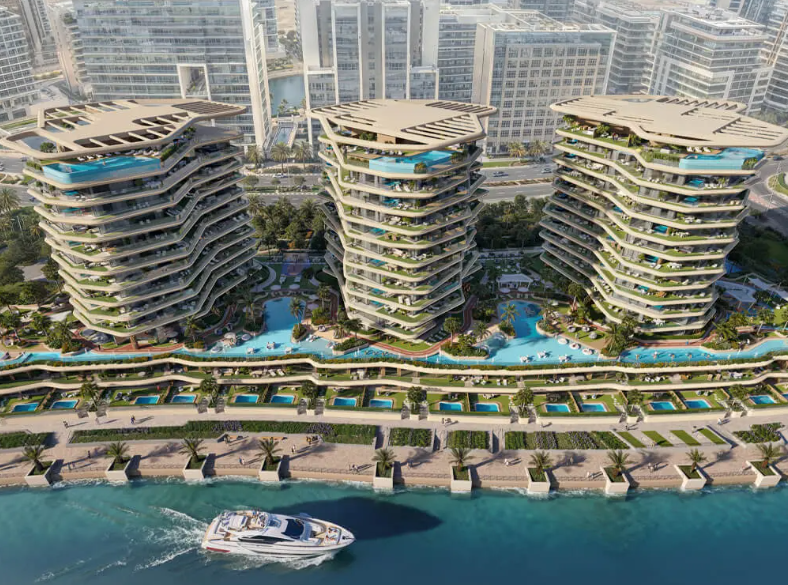
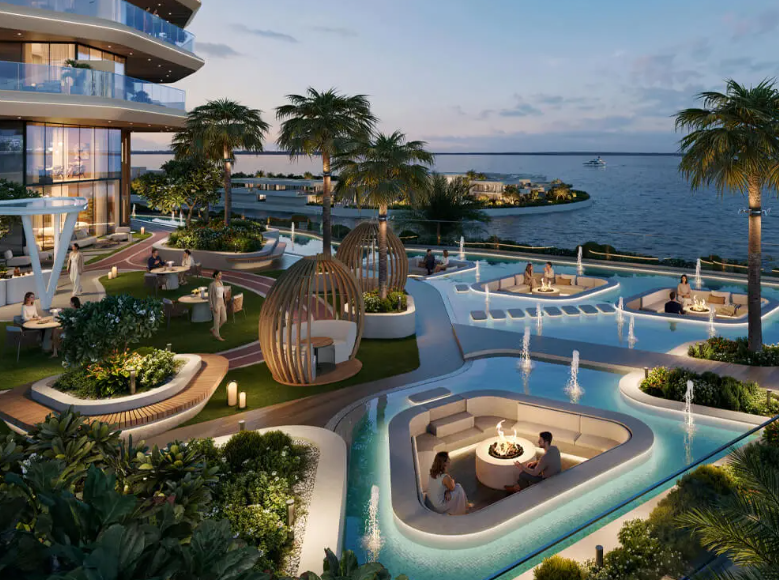
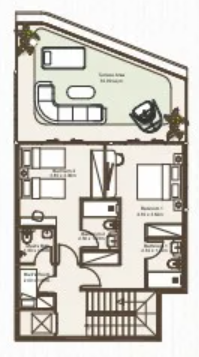
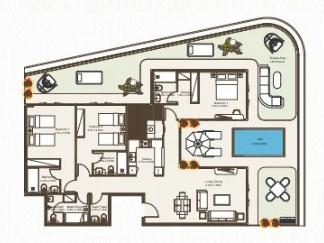
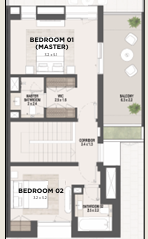
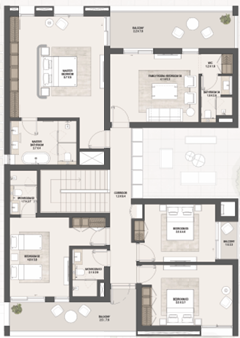
2 Bedrooms Apartment in Dubai, Mohammed Bin Rashid City (MBR) - 6193
AED 3,450,000
AED 3,105,000
Size:
1,006 sqft
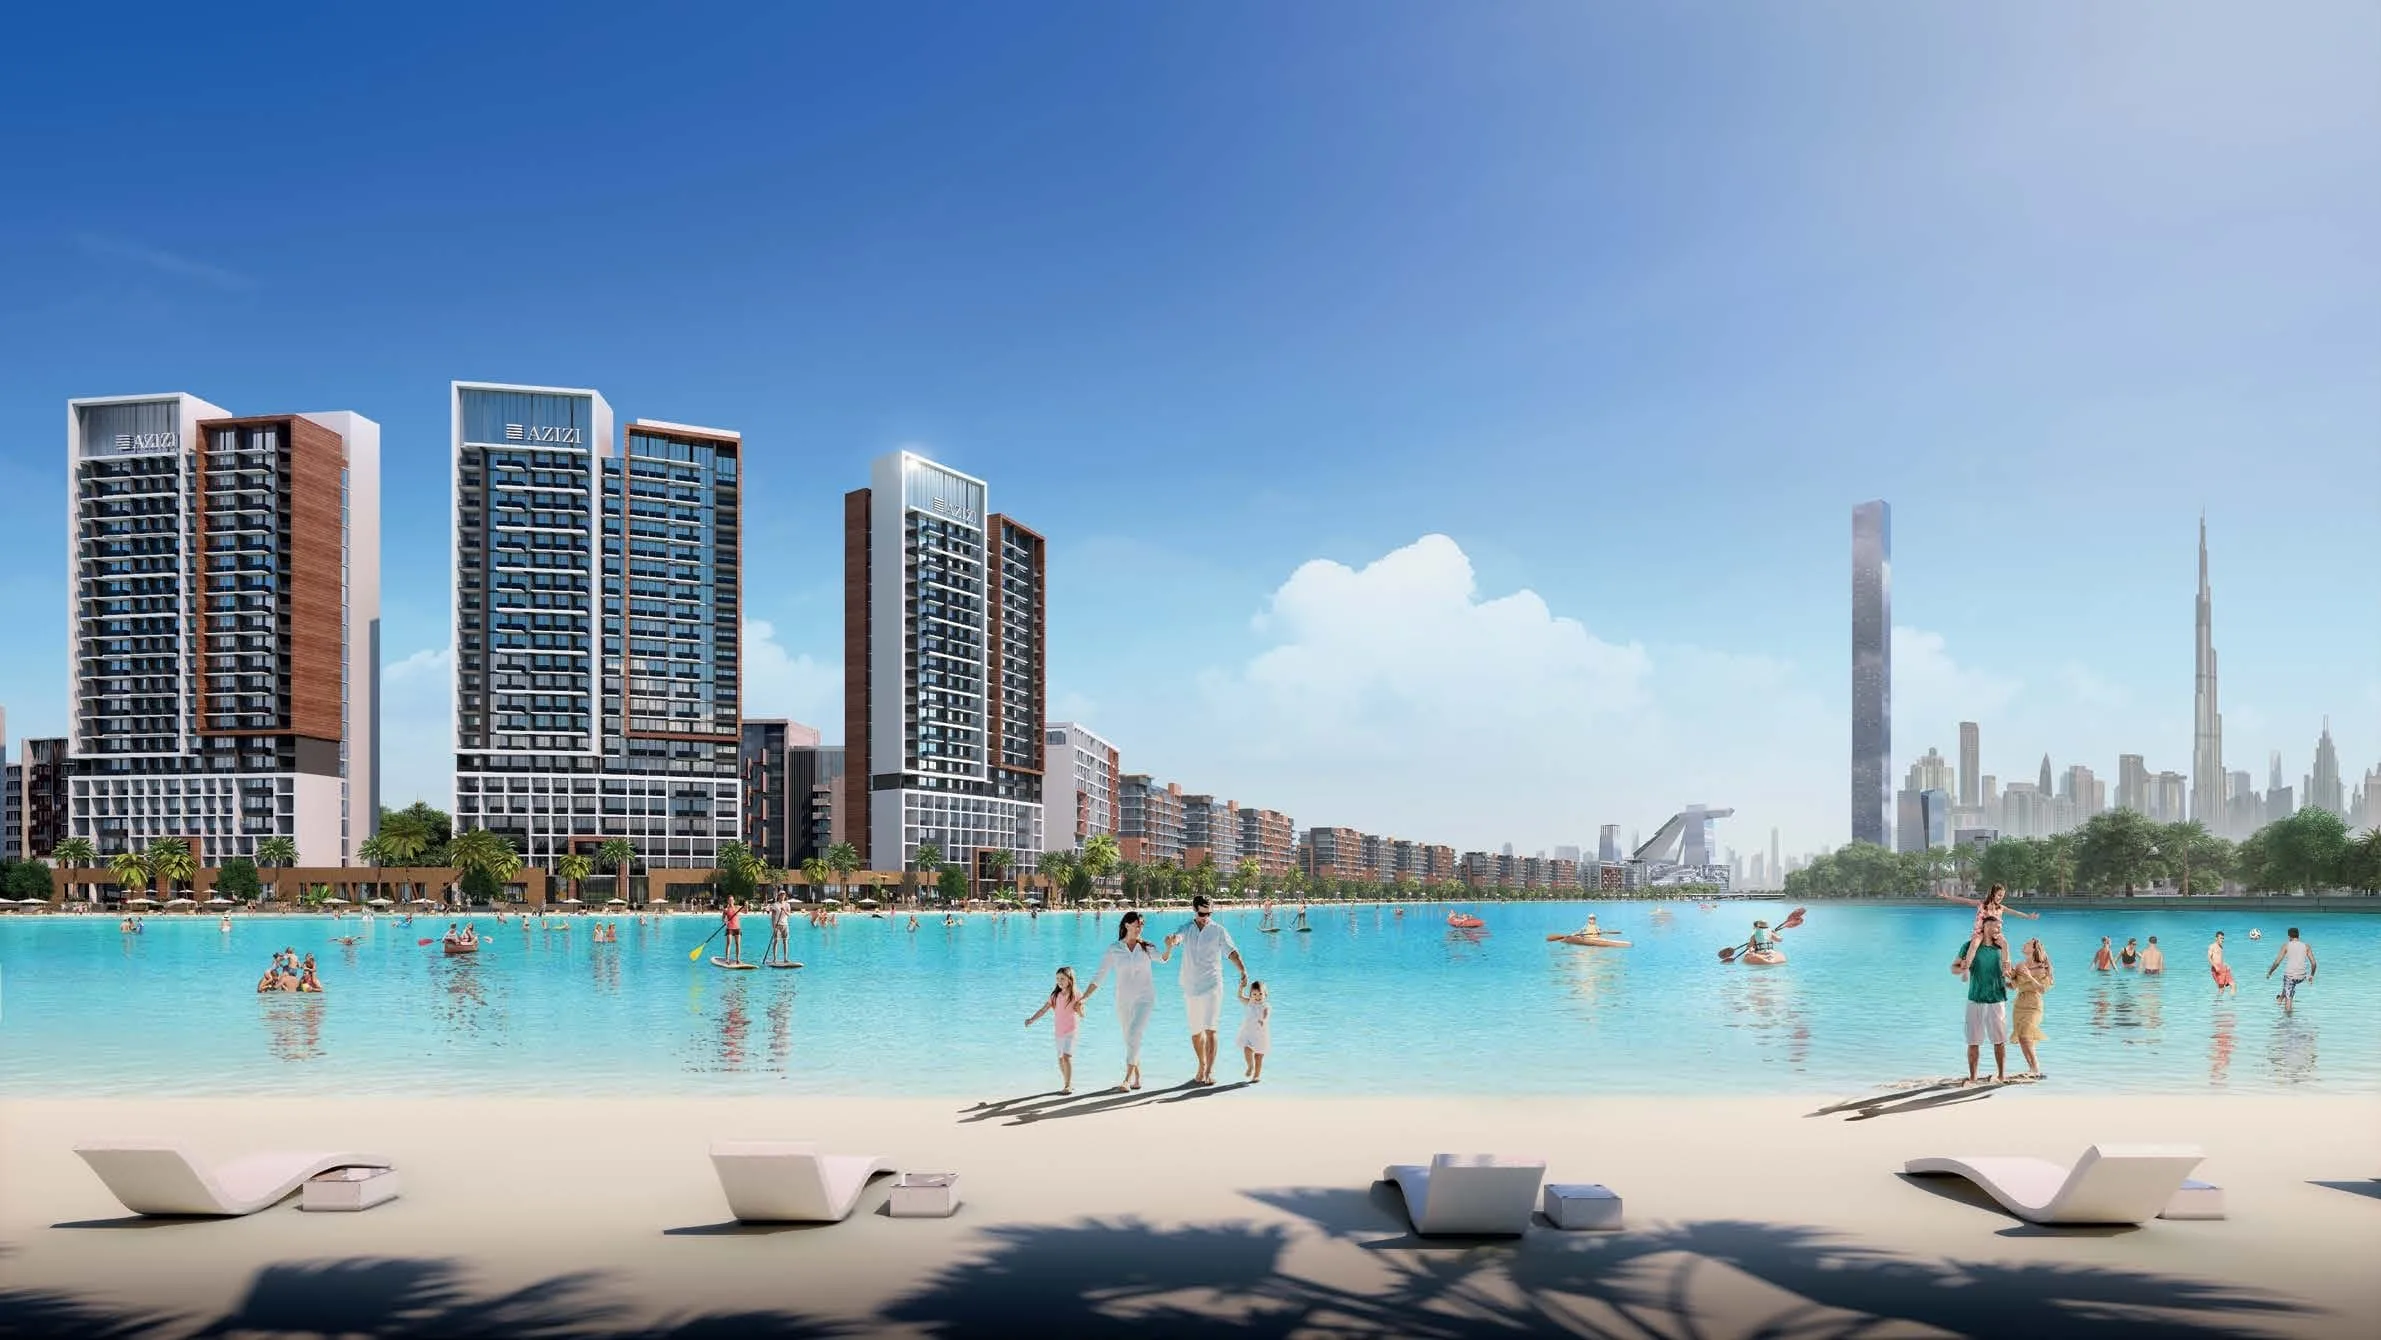
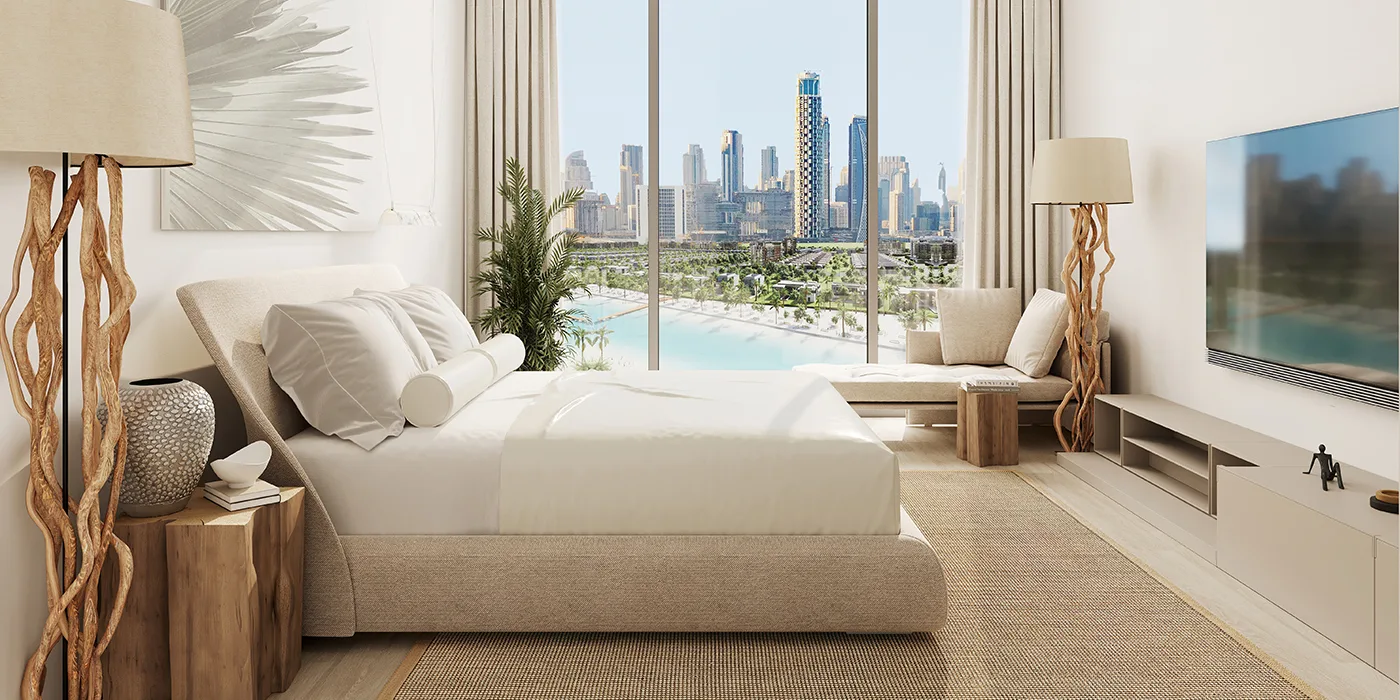
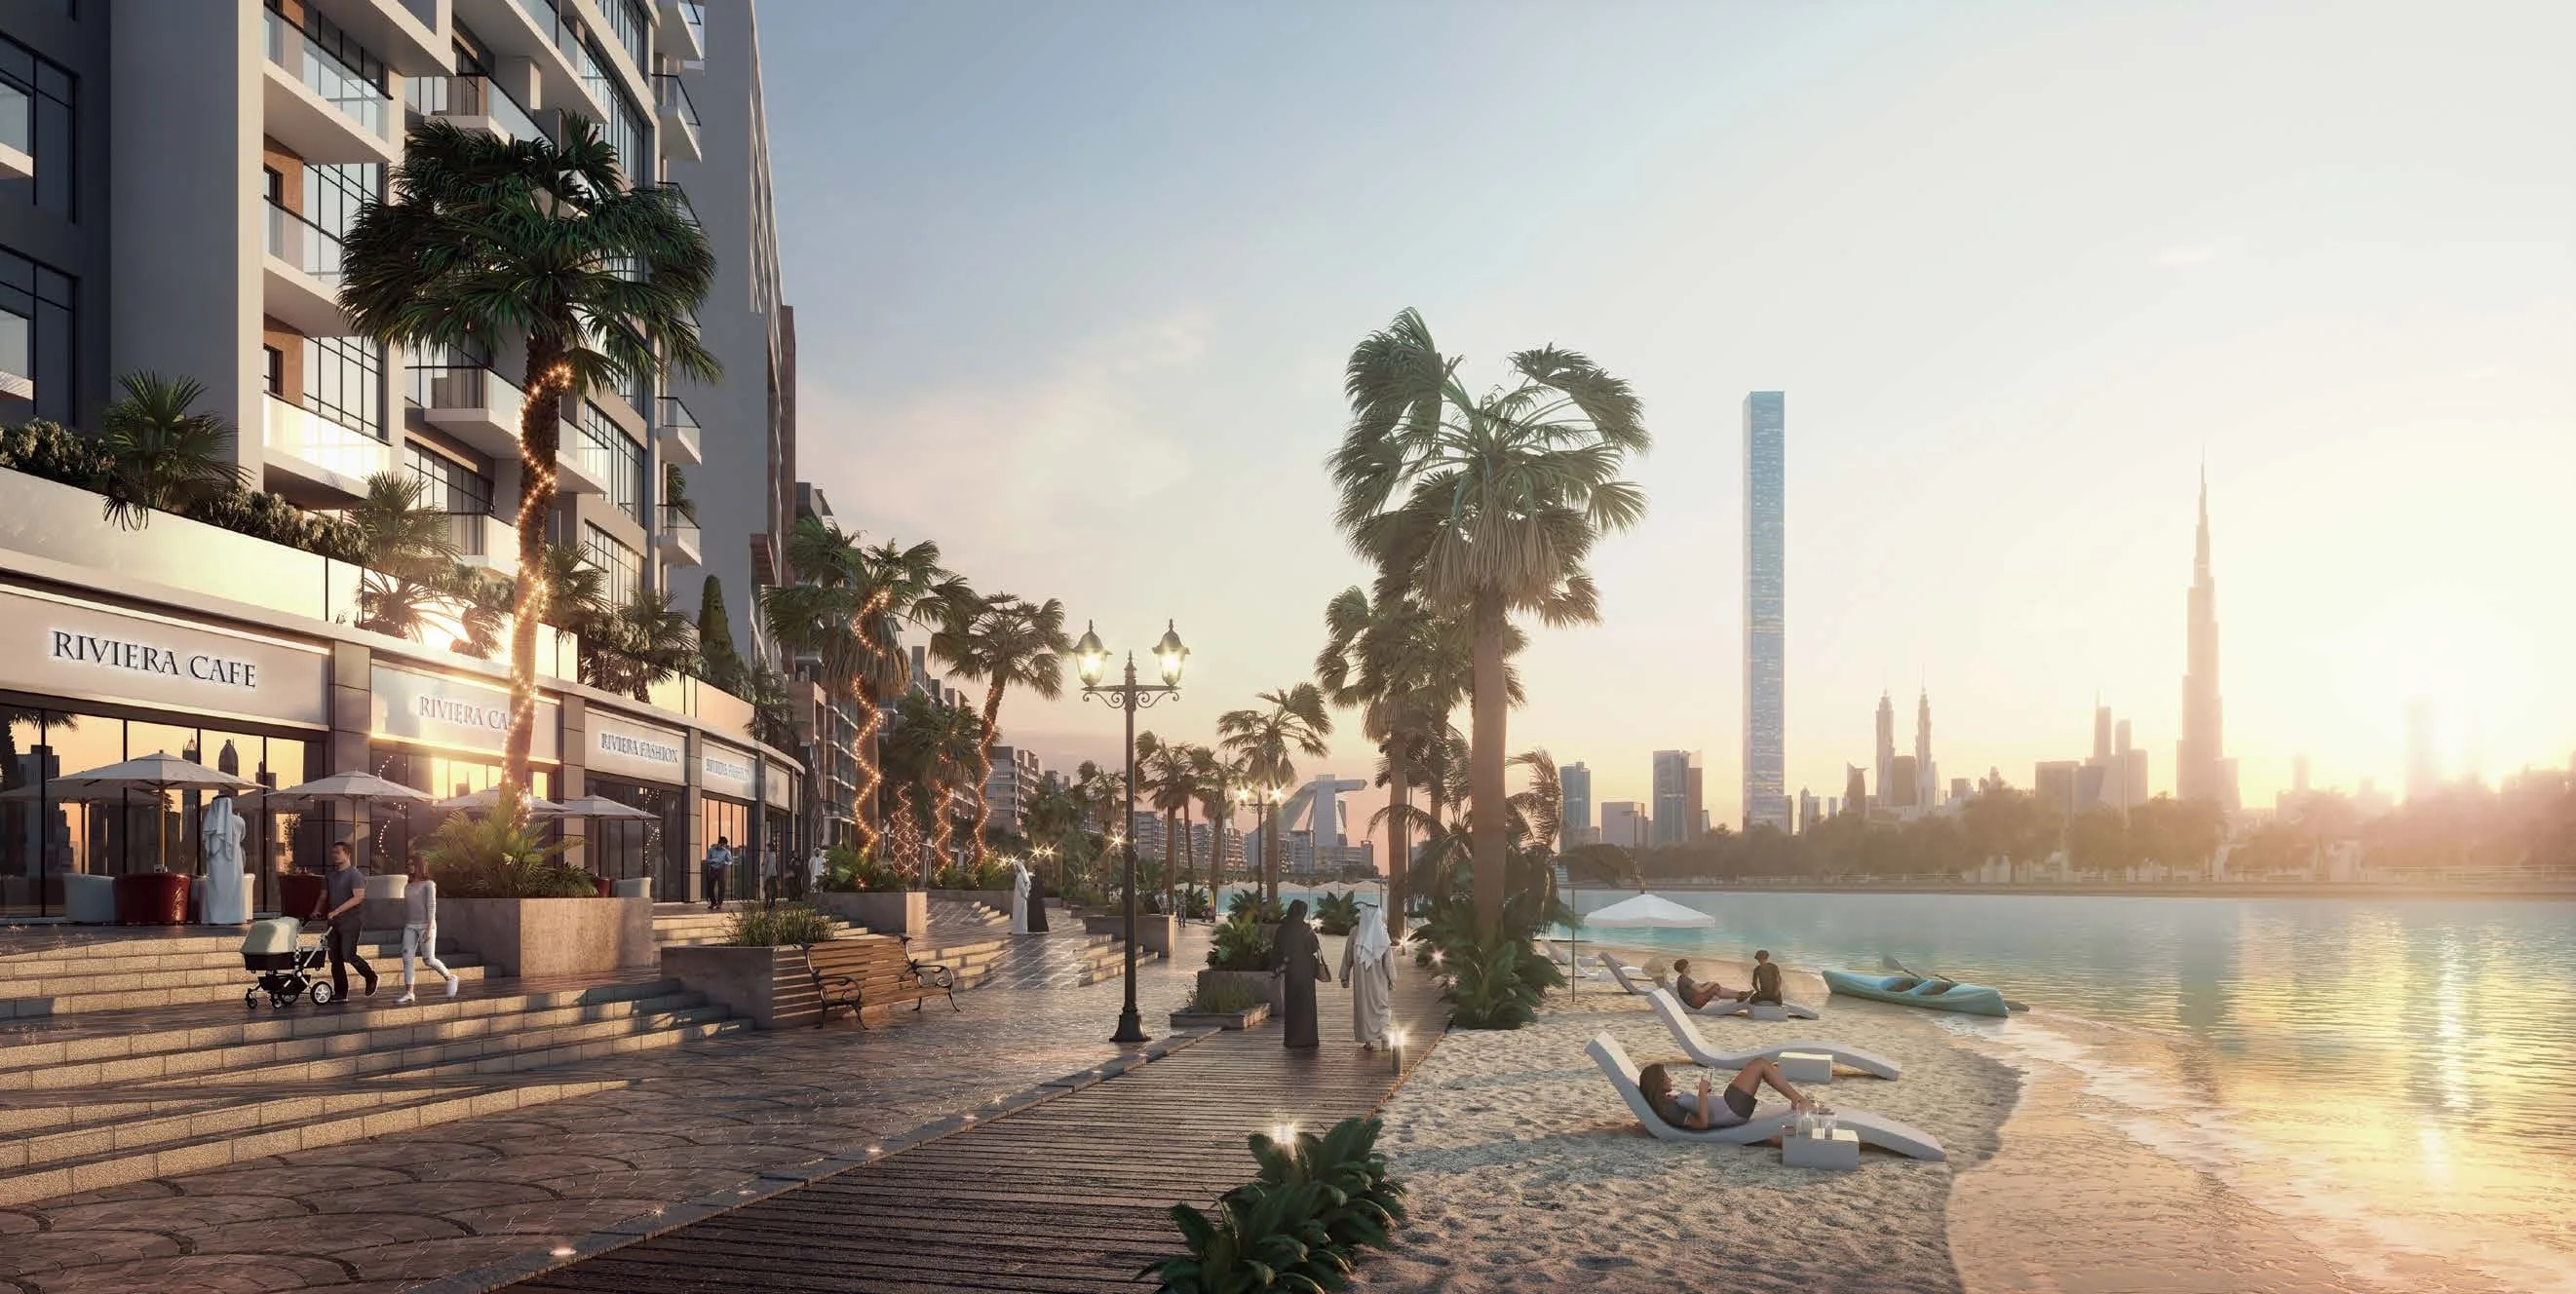
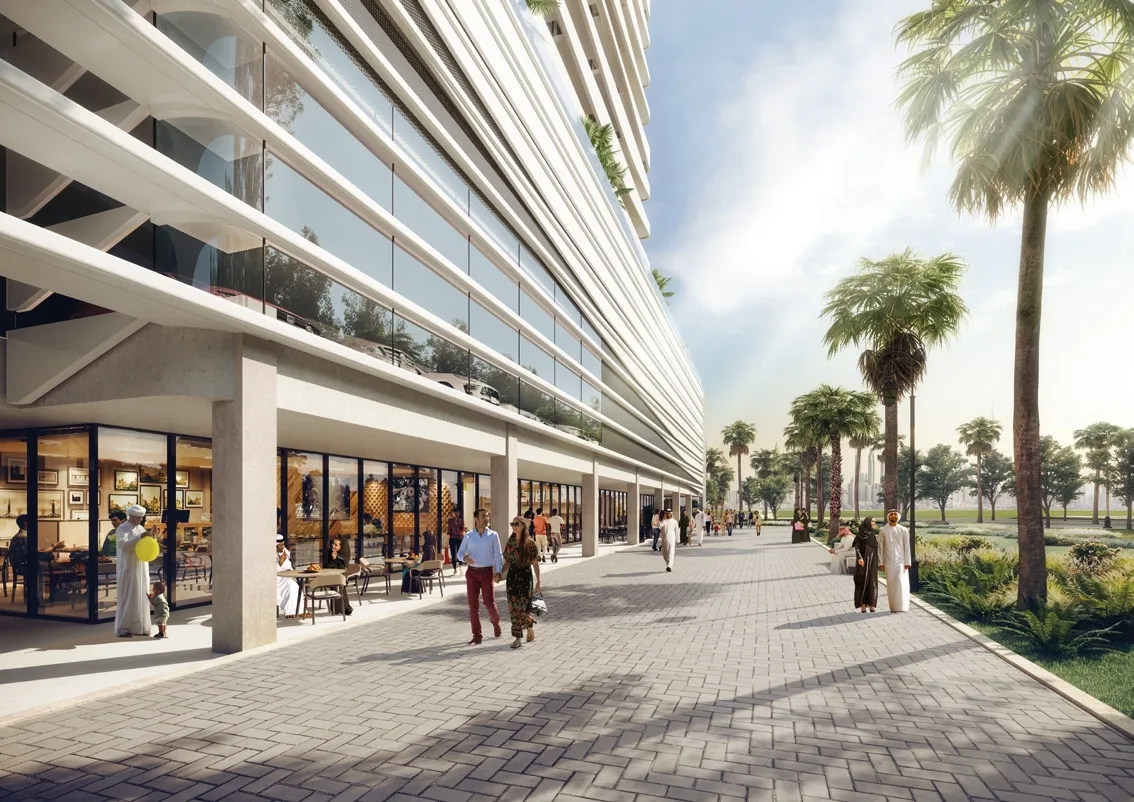
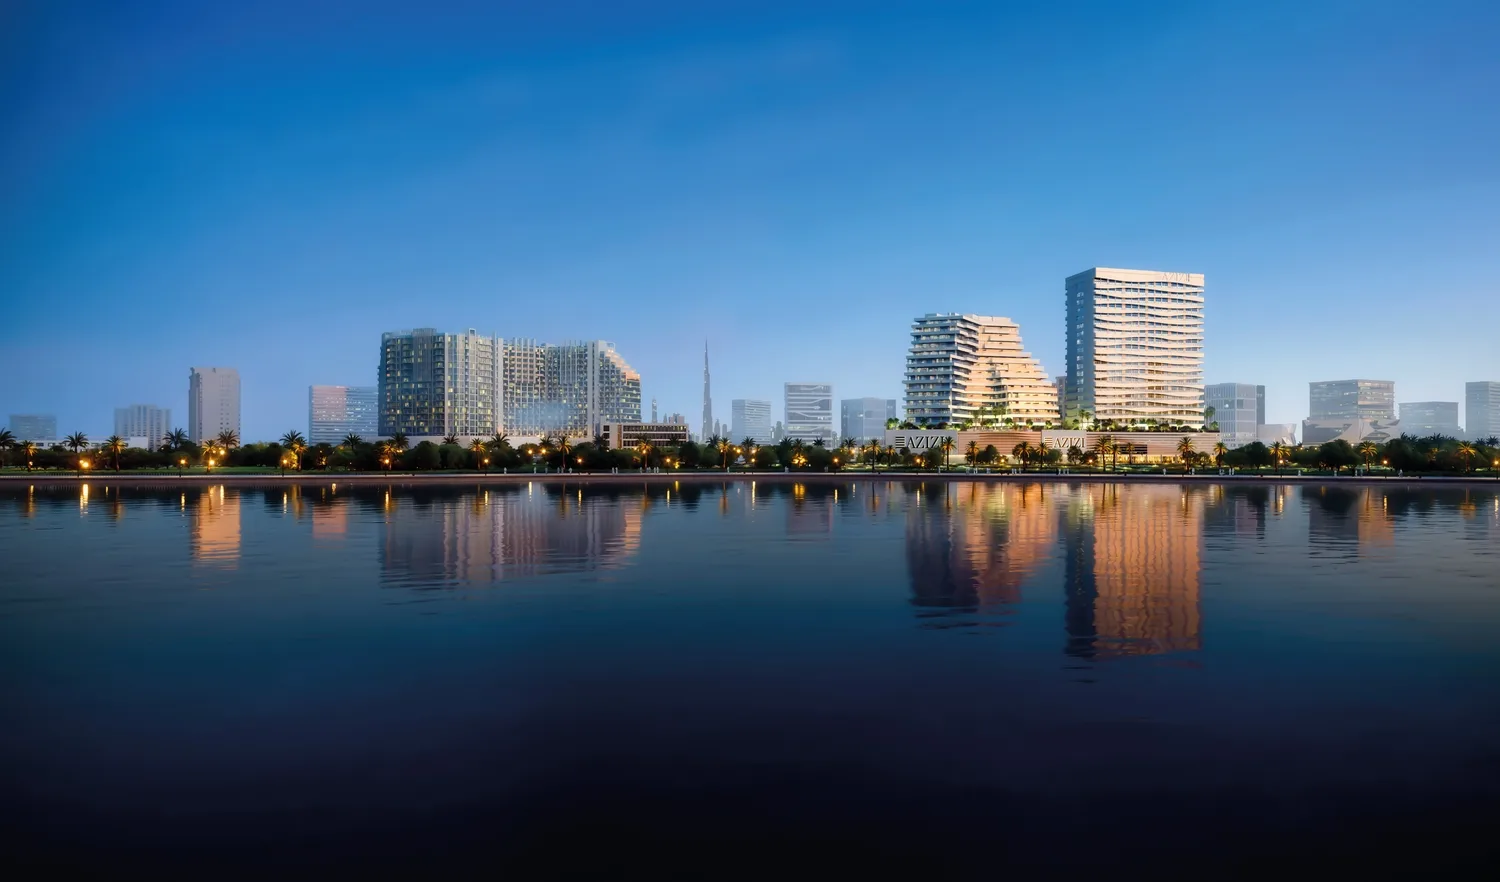
Location:
Dubai,
Mohammed Bin Rashid City (MBR)
Price / sqft:
AED 3,086
Avg price / sqft:
AED 3,832
Status:
Off plan
Handover:
Q4 2024
AED 345,000 discount for full advanced payment
10% off
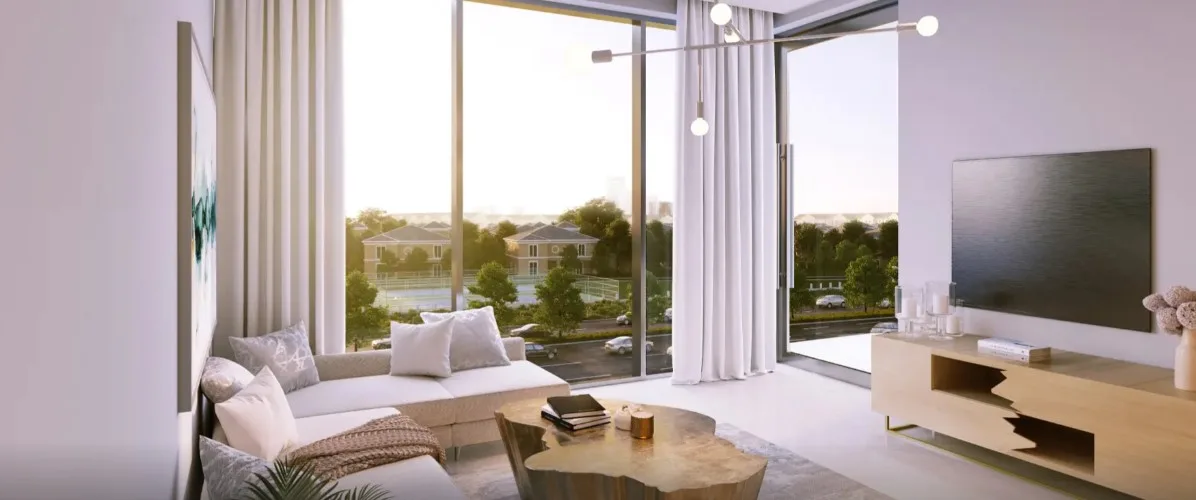
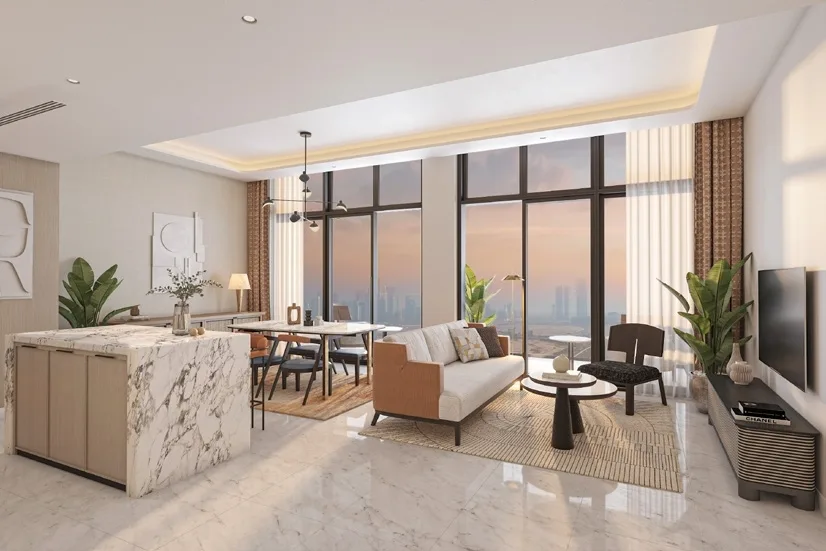
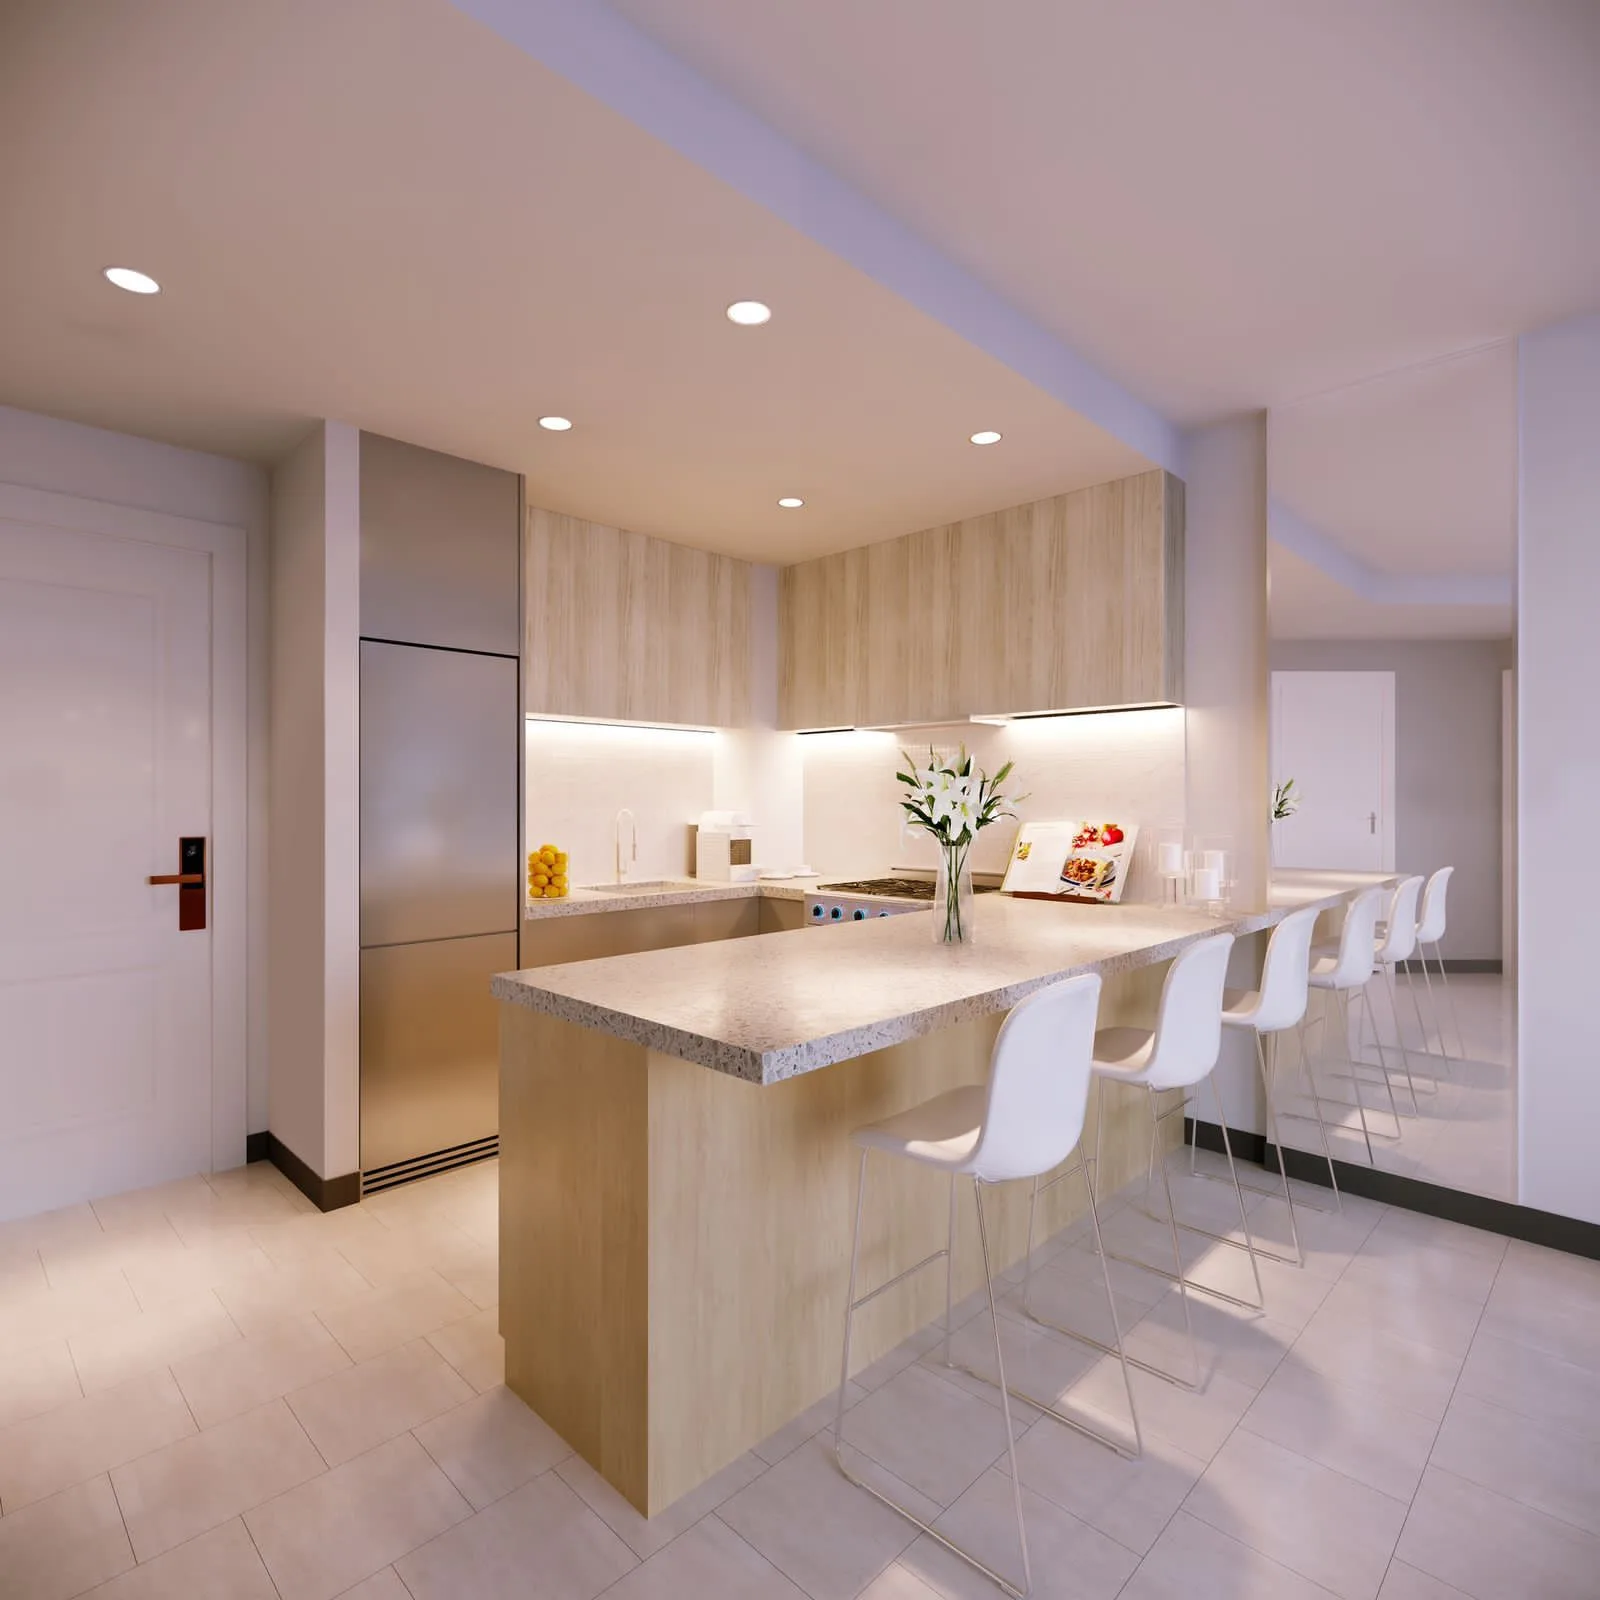
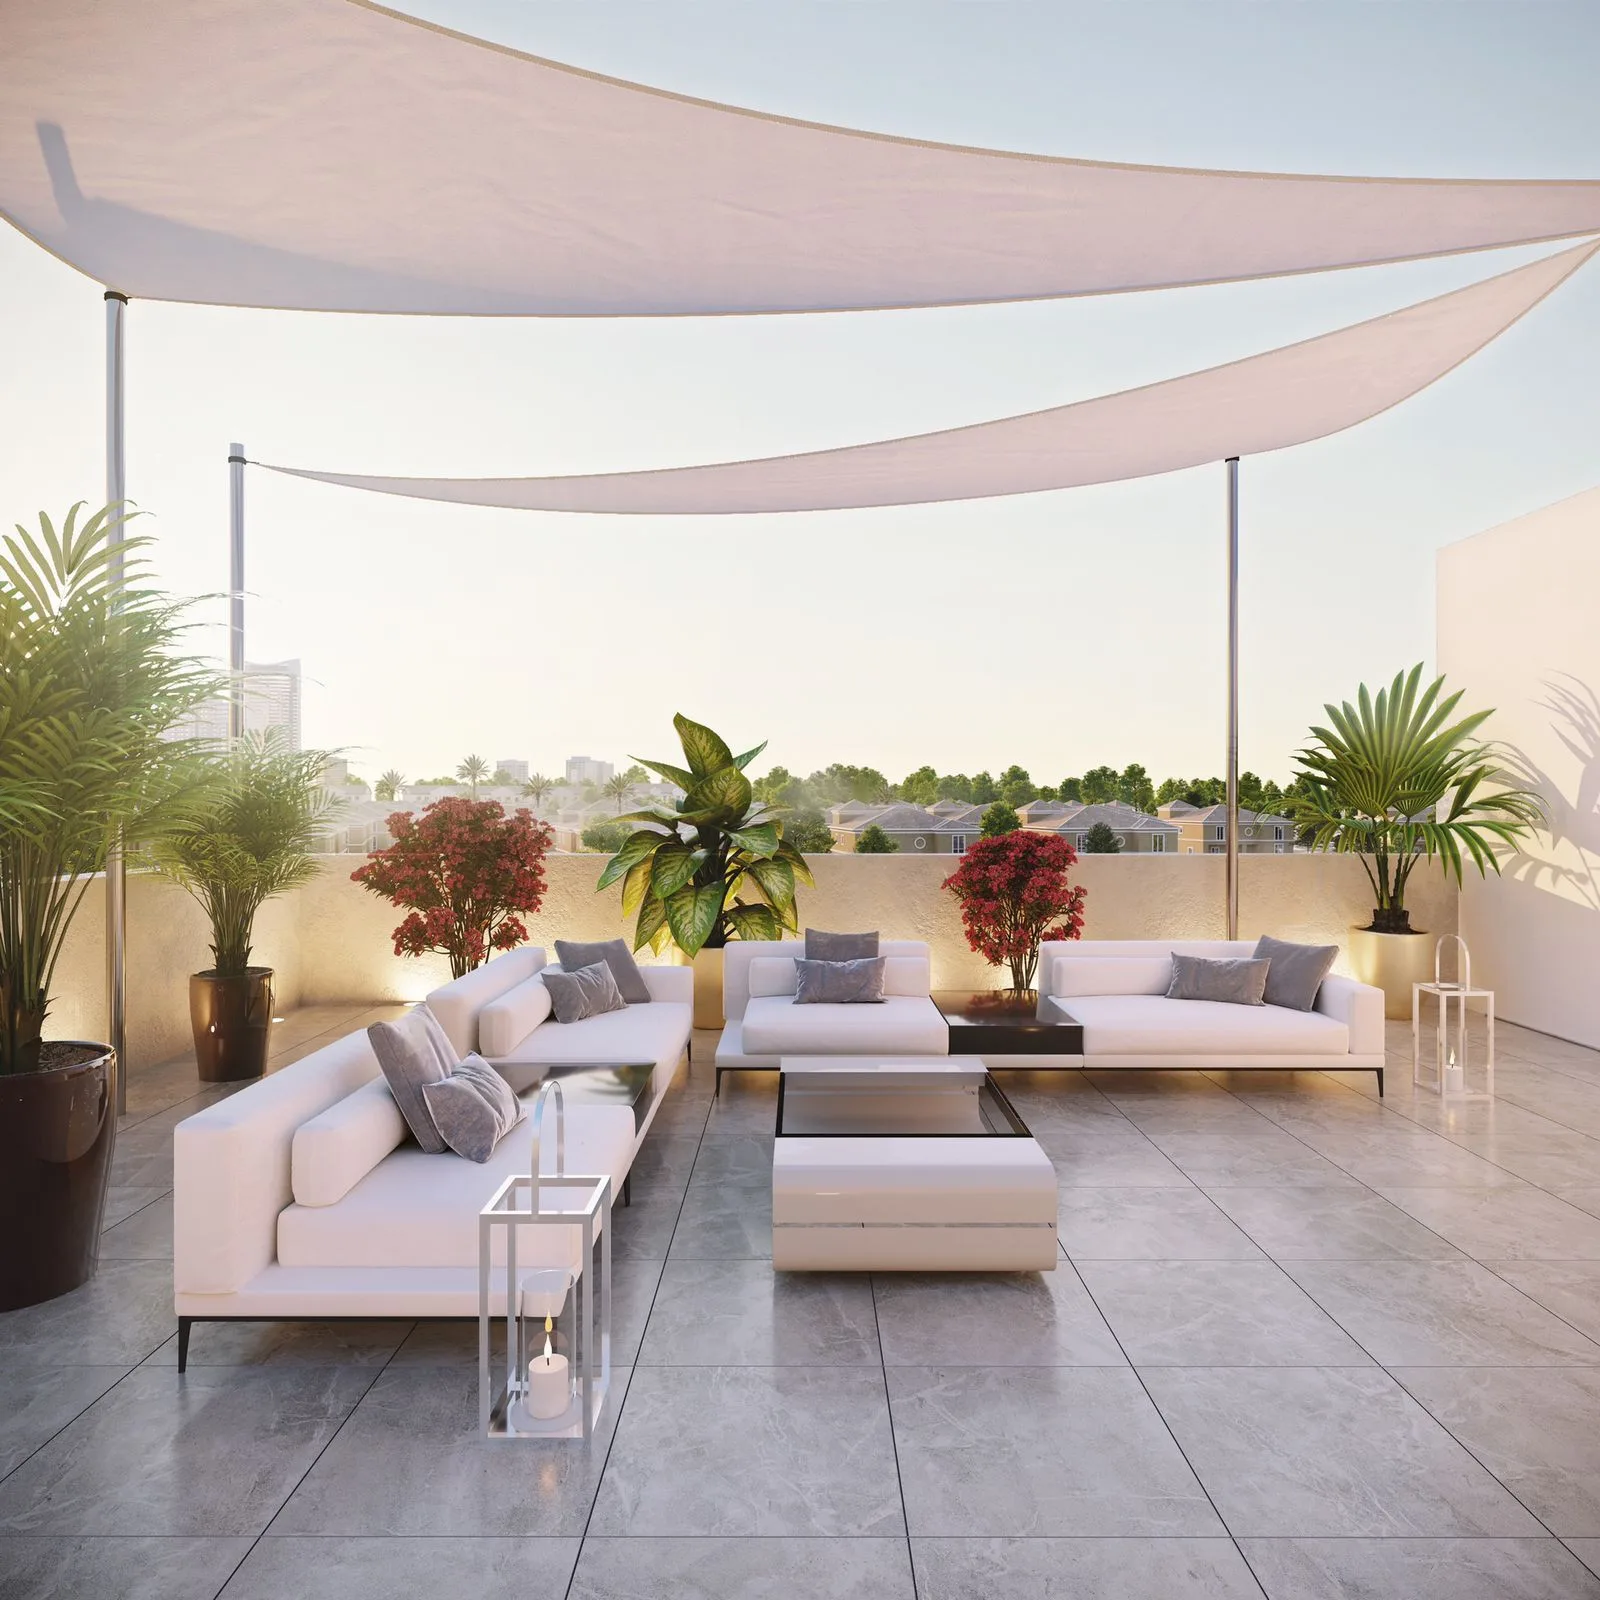
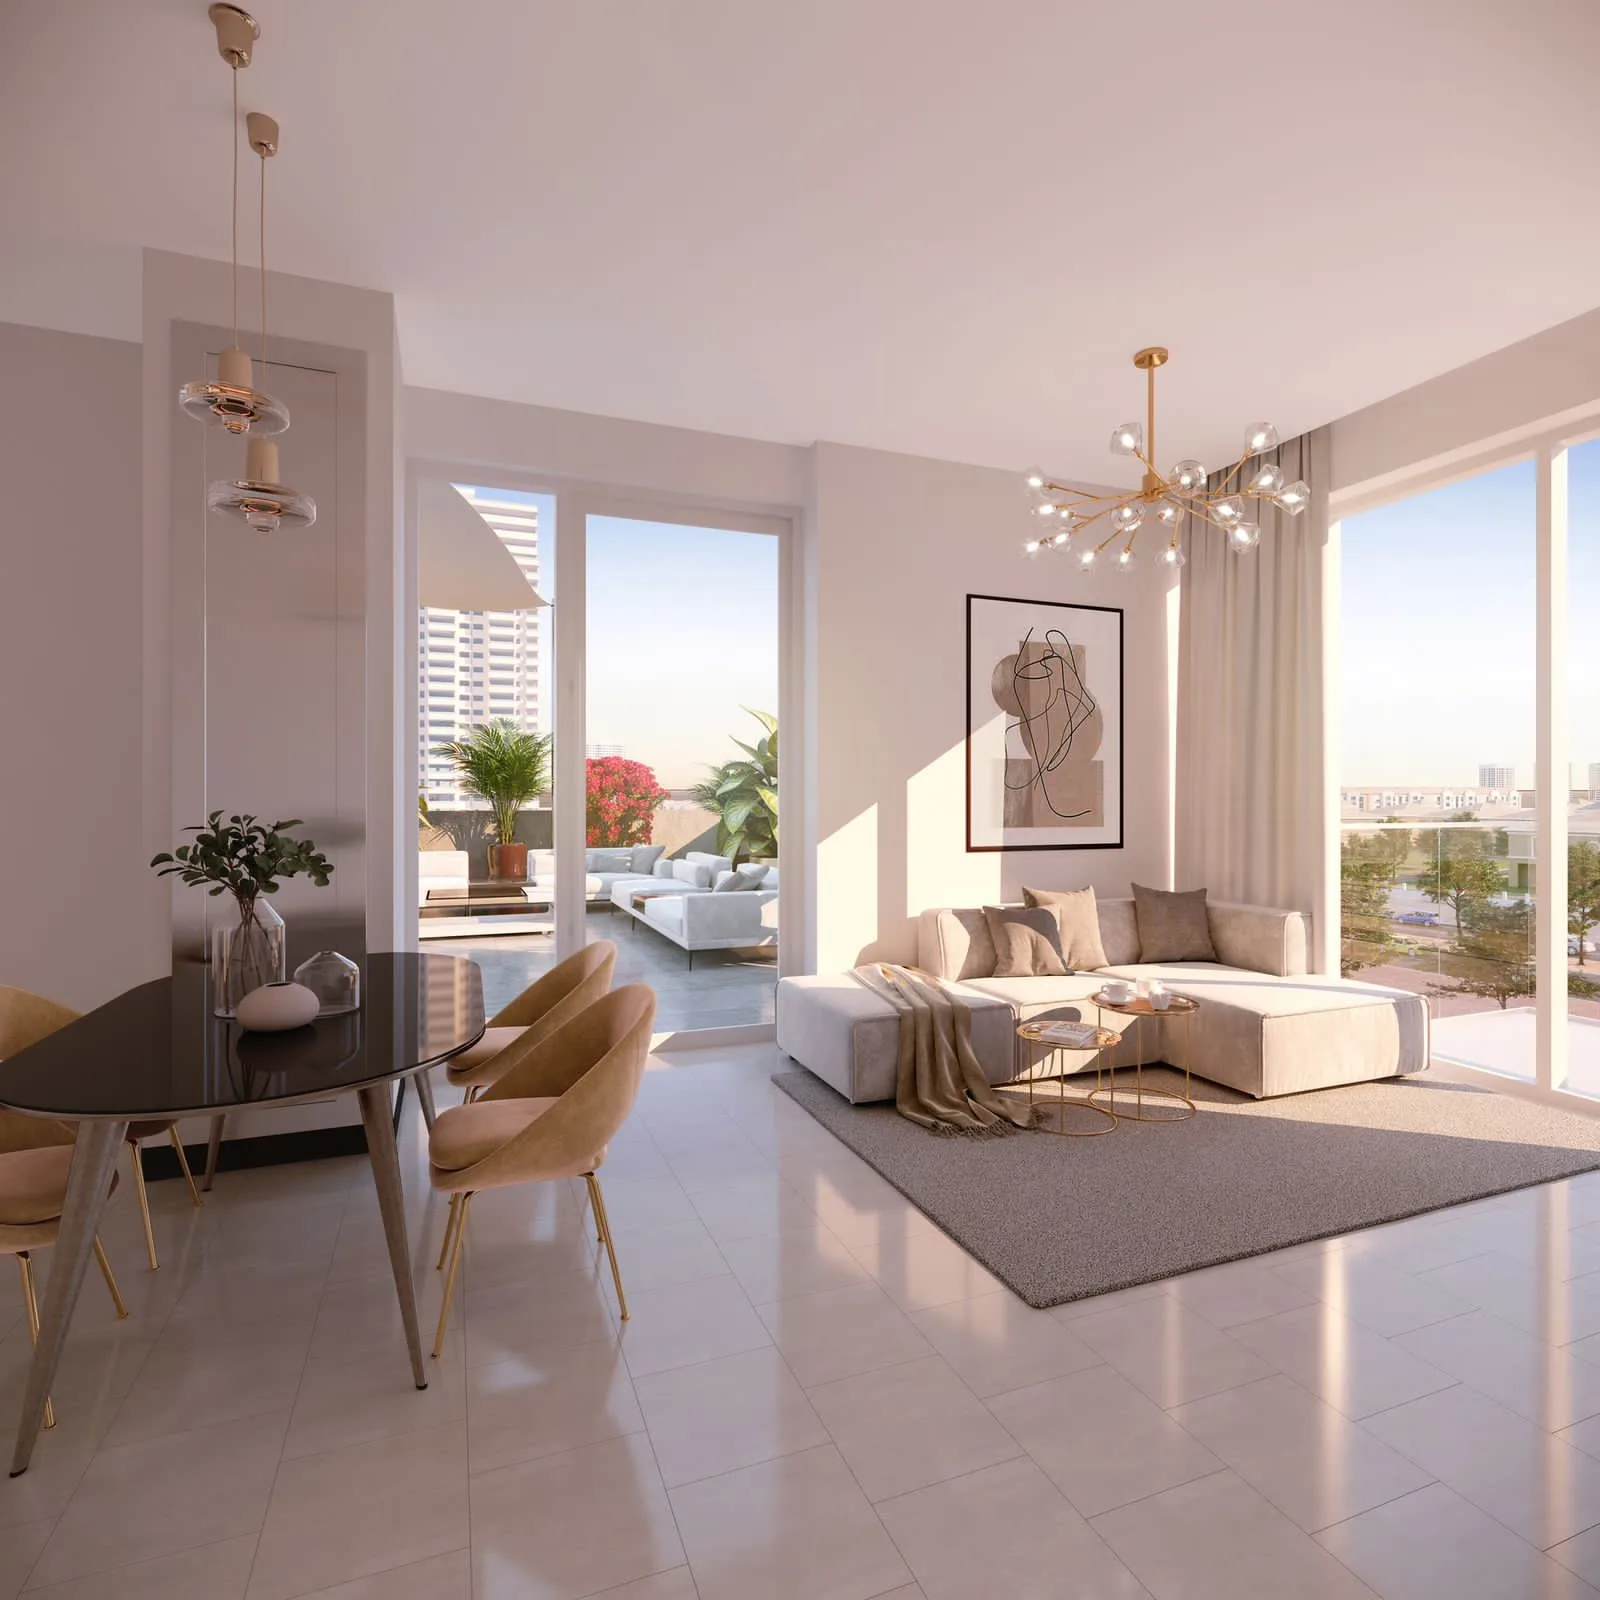
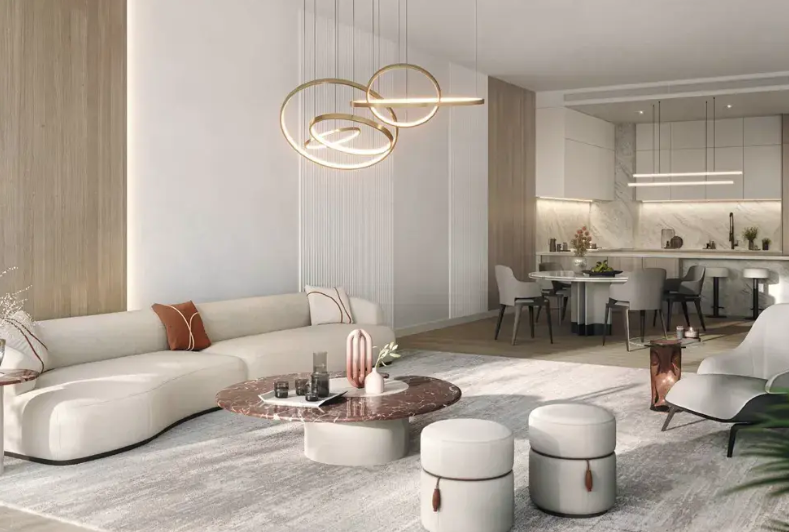
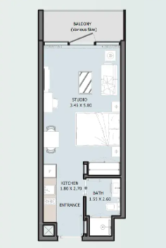
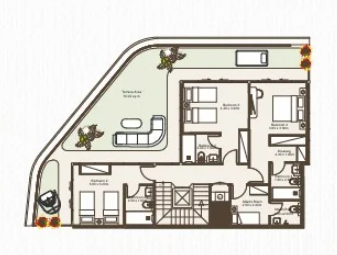
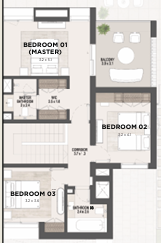
1 Bedroom Apartment in Dubai, Mohammed Bin Rashid City (MBR) - 6192
AED 2,259,000
AED 2,033,100
Size:
642 sqft
Location:
Dubai,
Mohammed Bin Rashid City (MBR)
Price / sqft:
AED 3,167
Avg price / sqft:
AED 3,483
Status:
Off plan
Handover:
Q4 2024
AED 225,900 discount for full advanced payment
10% off


")


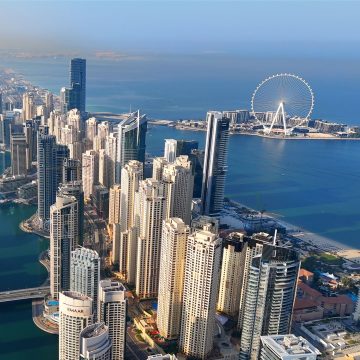
The Complete Guide to Dubai Marina
The Complete Guide to Dubai Marina Dubai Marina is one of the most dynamic waterfront communities in Dubai, known for its spectacular skyline, high-end residences,

The Complete Guide to Dubai Business Bay
The Complete Guide to Dubai Business Bay Business Bay is one of Dubai’s most strategic mixed-use districts, offering a seamless blend of upscale residences, world-class
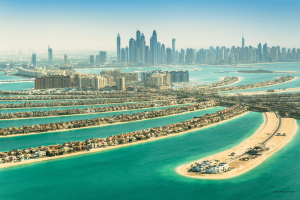
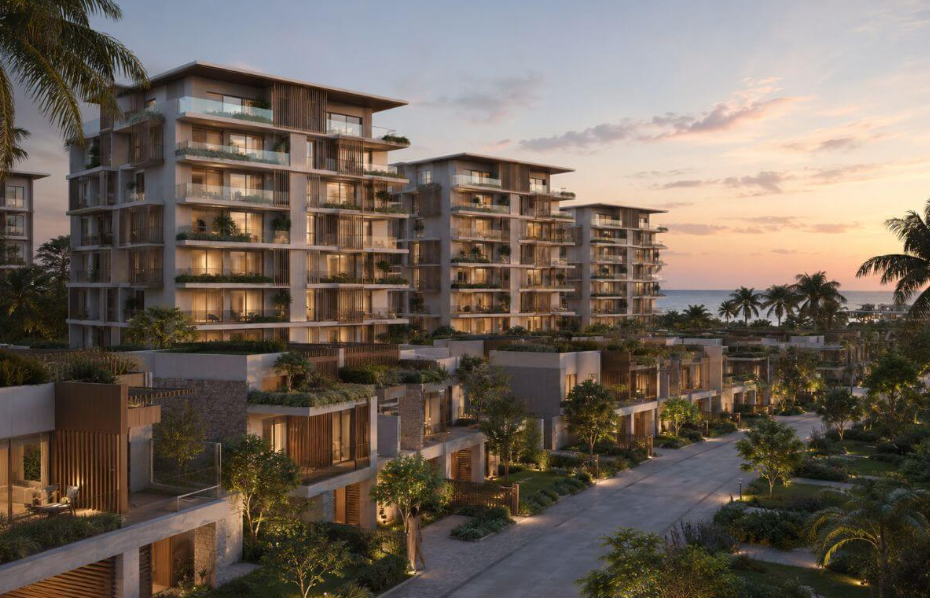
The Complete Guide to Palm Jumeirah in Dubai
The complete guide to Palm Jumeirah in Dubai Palm Jumeirah is the most iconic artificial island in Dubai and a globally recognized symbol of luxury